Towards Automatic Personal Value Estimation in Song Lyrics with Large Language Models
Abstract:
Most widely consumed music in Western countries includes song lyrics, with US samples indicating that nearly all personal song libraries contain lyrics. Social science theory suggests that personal values expressed in widely consumed text, like song lyrics, may align with or diverge from those of the listener, potentially shaping their response to the music. This highlights the potential of automated value estimation in lyrics for downstream music information retrieval (MIR) tasks, like personalization. Like prior work, we adopt a perspectivist approach informed by social science theory to reliably collect annotations and assess their quality. We then use a novel approach to automatically estimate values in song lyrics using large language models (LLMs), combined with programmatic prompt optimizer DSPy, gathering multiple estimates from each LLM to estimate intra-model reliability. We then compare aggregated human ratings with aggregated ratings from a subset of the most reliable LLMs, showing promising initial results. At the same time, in response to concerns about the energy footprint of LLMs, we monitor energy usage. We conclude that the results are a positive step forward in terms of estimating values in lyrics, but open challenges remain on the side of reliability and power requirements.
Supplementary Materials
This is a companion repository for our ISMIR 2025 submission. What follows is material from the publication and additional plots that didn’t make it into the manuscript with accompanying explanations.
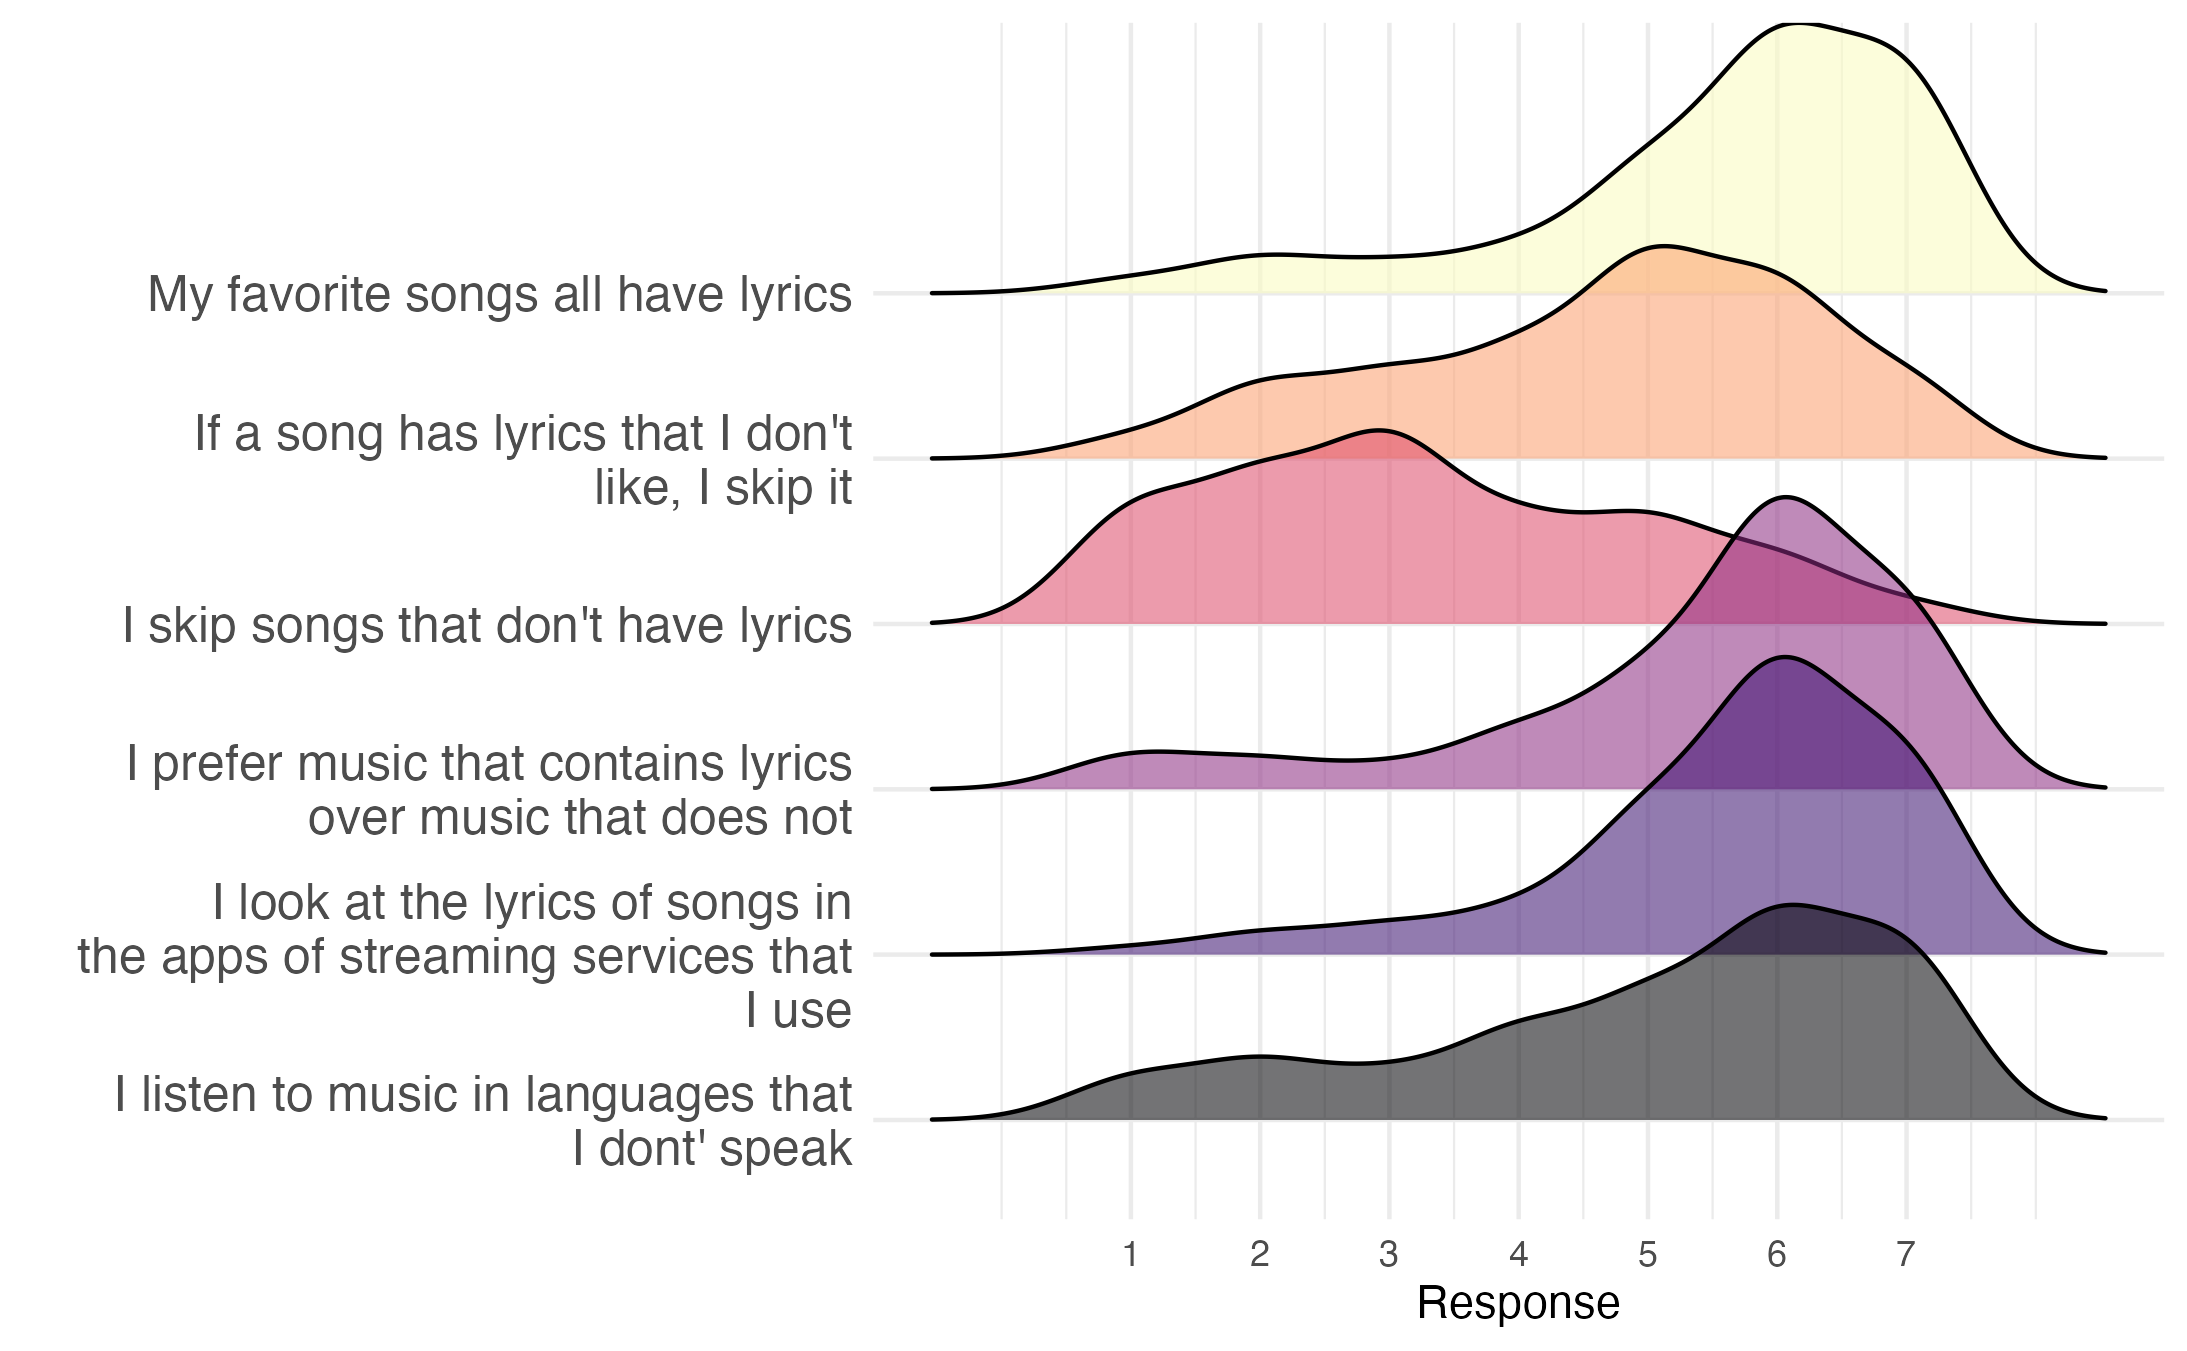
Participants
We asked participants in our pilot study (n=100) about their lyric preferences, and whether they think it affects thier music listening behavior.
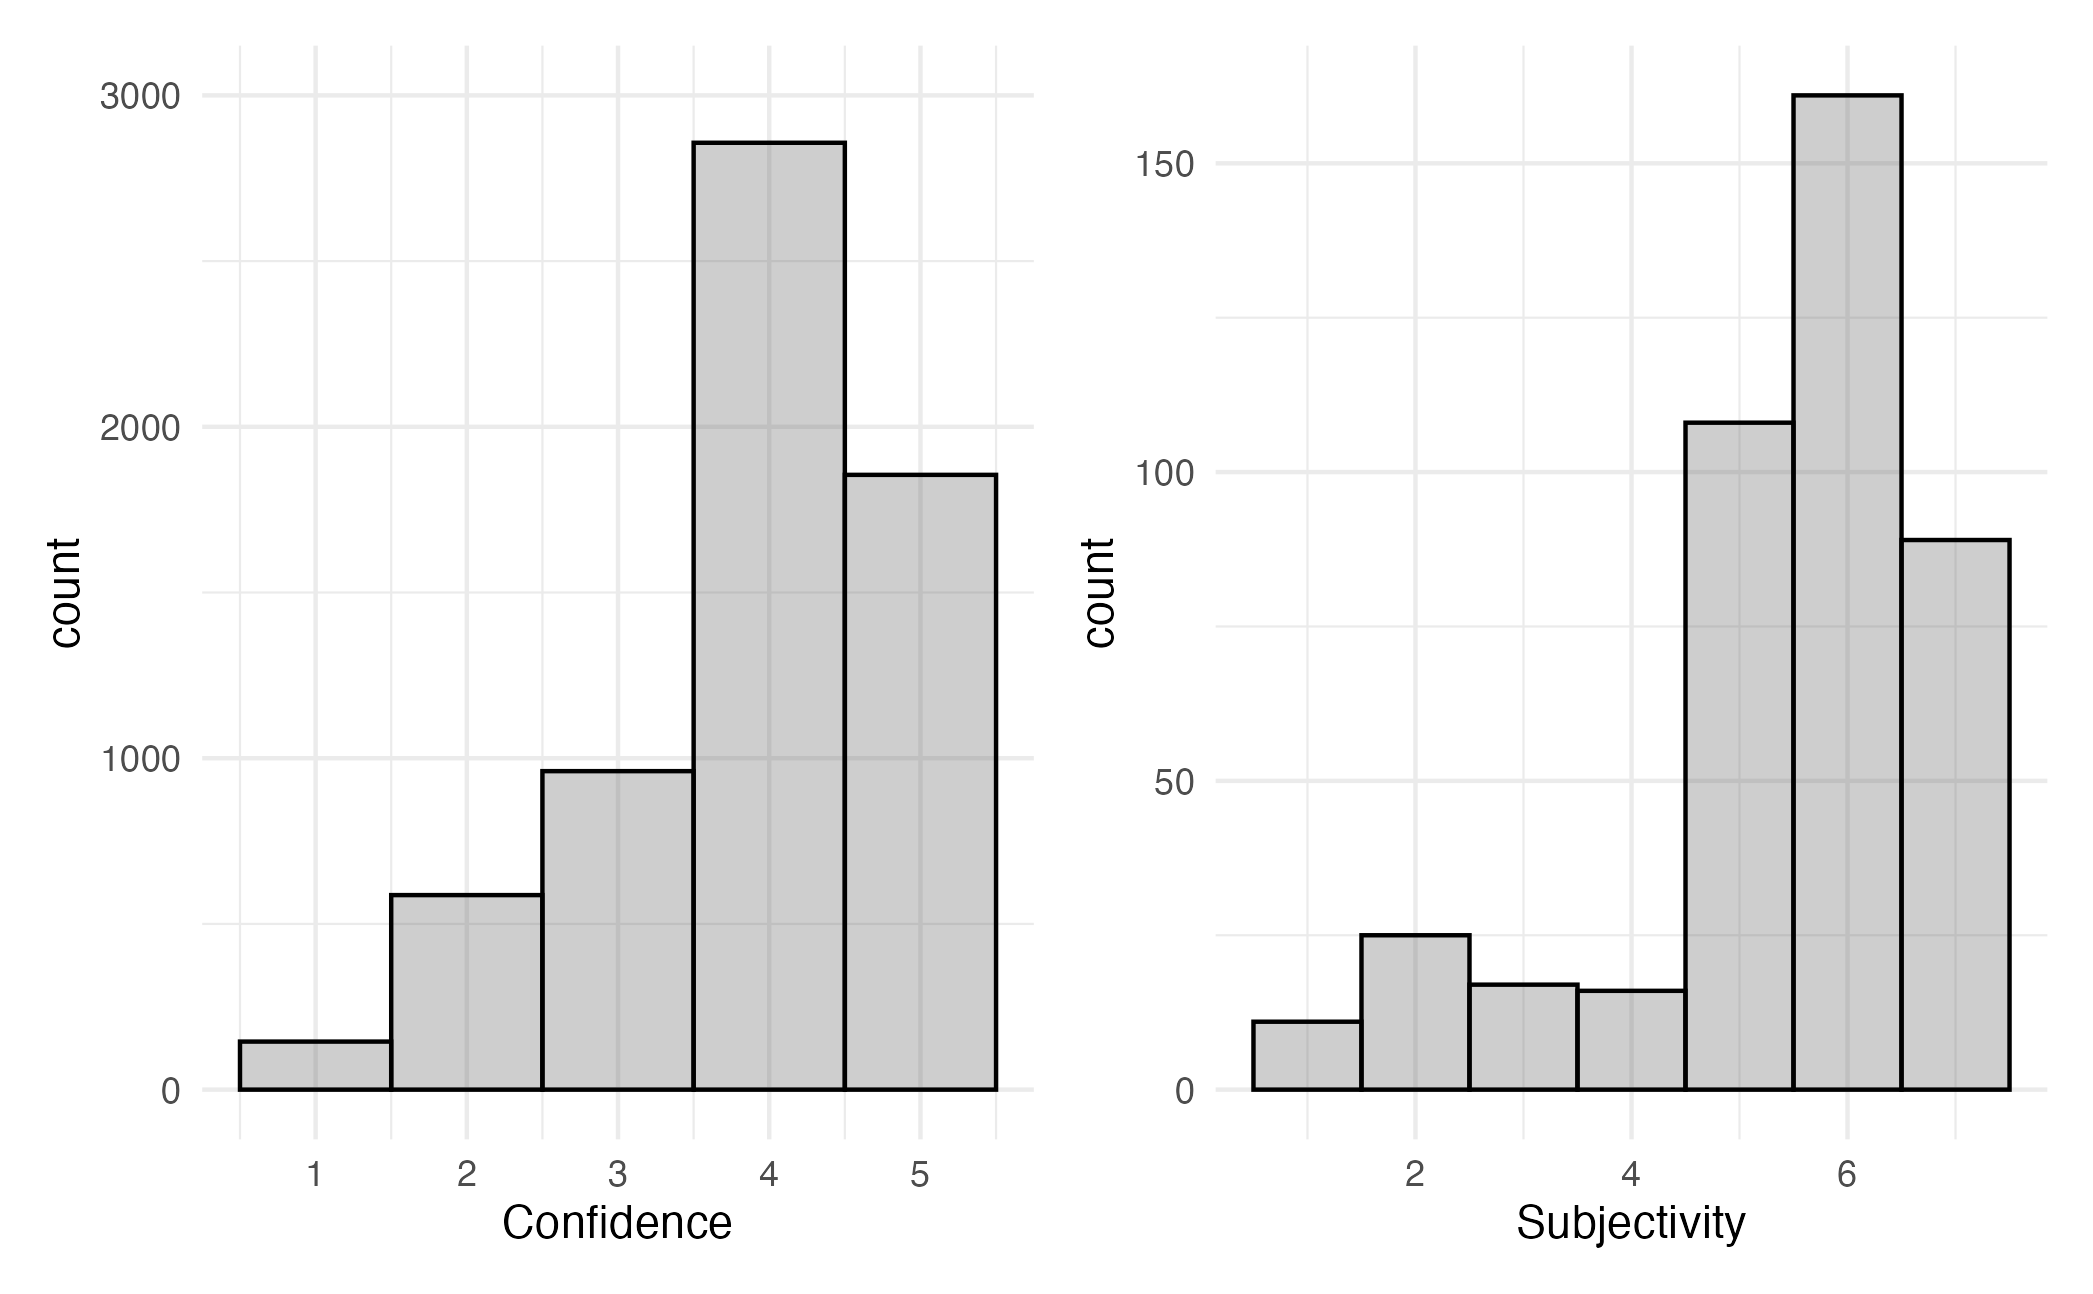
In our main annotation data collection wave, we asked participants how confident they were in their ratings for each song, and how subjective they thought the task was overall. Although participants generally indicate high confidence in each of their ratings, they also indicate that they see this overall as a subjective task.
To determine the number of ratings per song, we used a bootstrapping procedure. We subsampled participants in increments of 5, 25 times each, and estimated inter-rater reliability, using the intra-class correlation coefficient. As we intend to use the mean of several ratings, we use type 2k. In addition, we compute the pearson correlation between the mean ratings of subsamples, and the overall mean.
We set a threshold at pearson correlations of .9, and ICC2k correlations at .75. We observe that we exceed the threshold at 15 ratings.
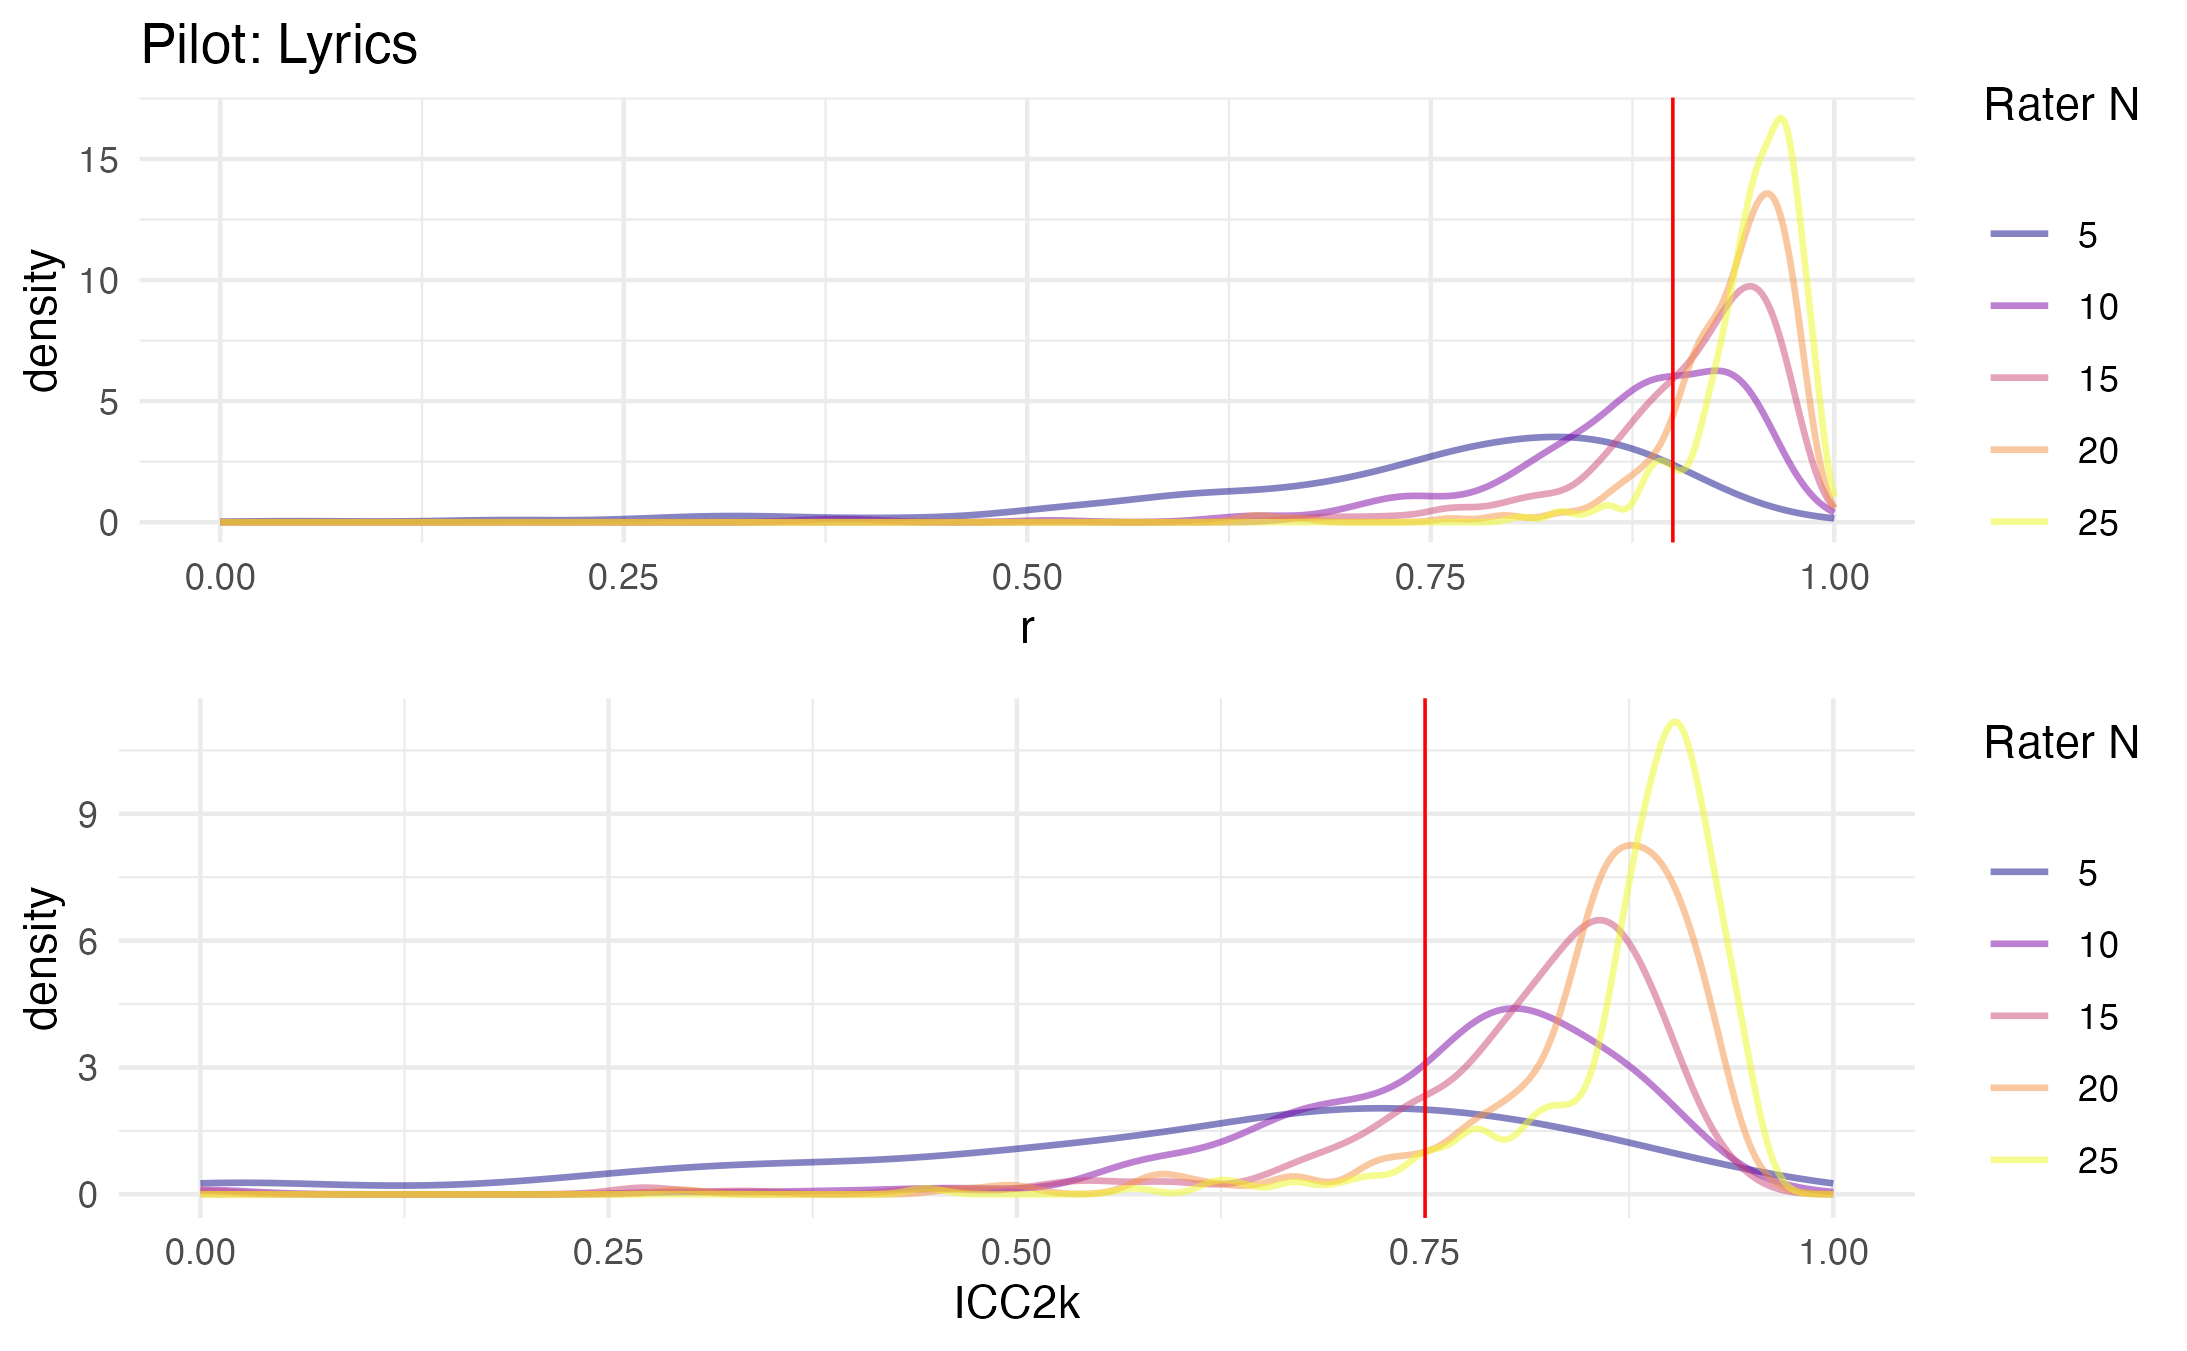
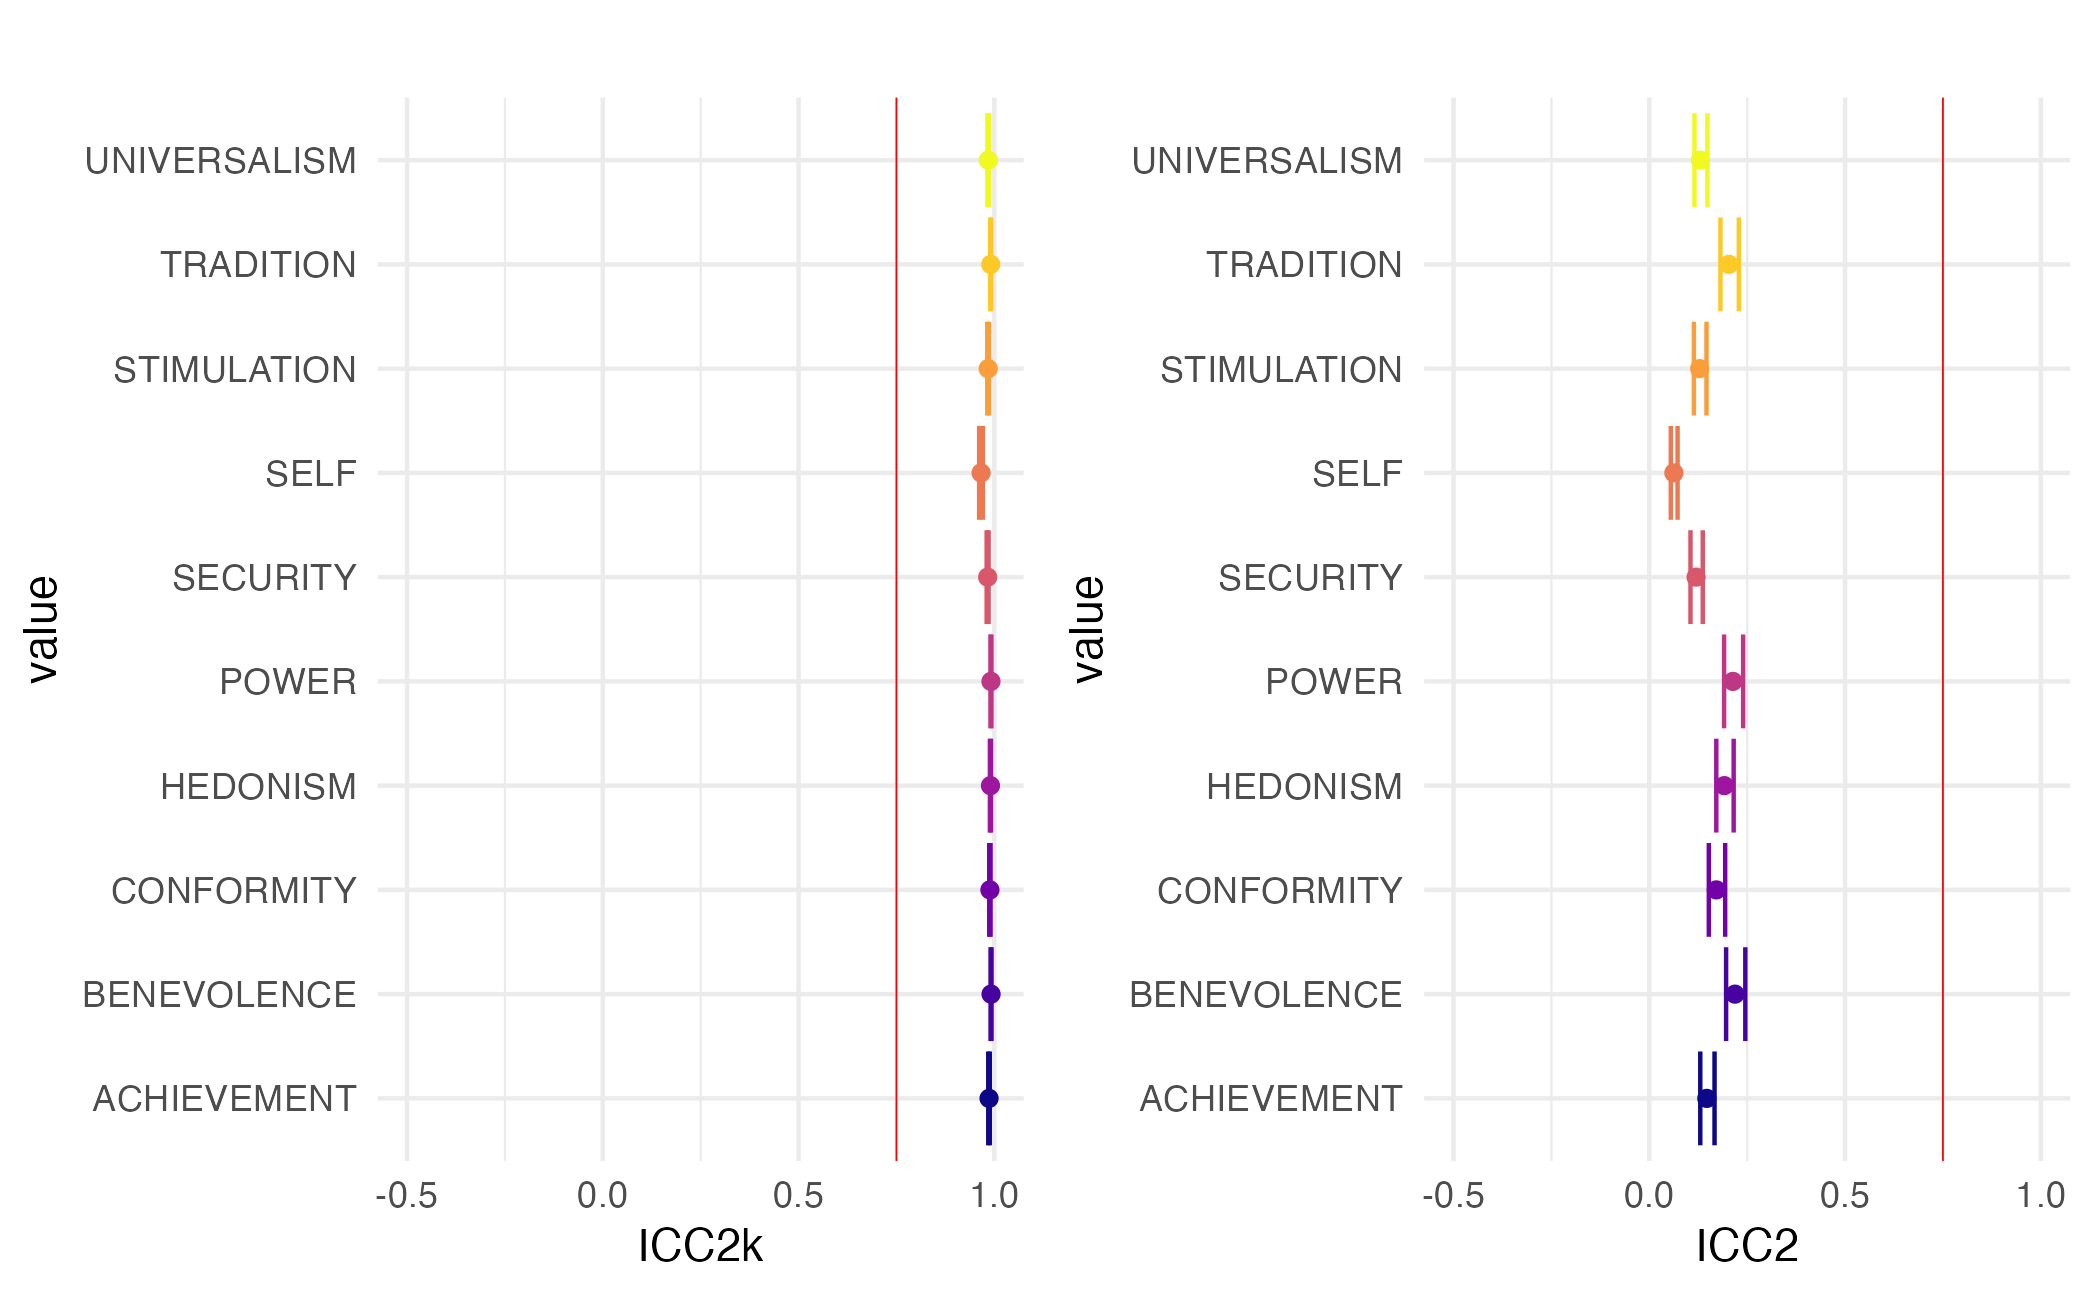
In our main data collection wave, we observe that the ICC2 scores show that participants don’t indicate the same score for the lyrics they annotate. However, the ICC2k scores are high, indicating that the scores from participants correlate.
Pilot Study: Model Selection and Run Number Estimation
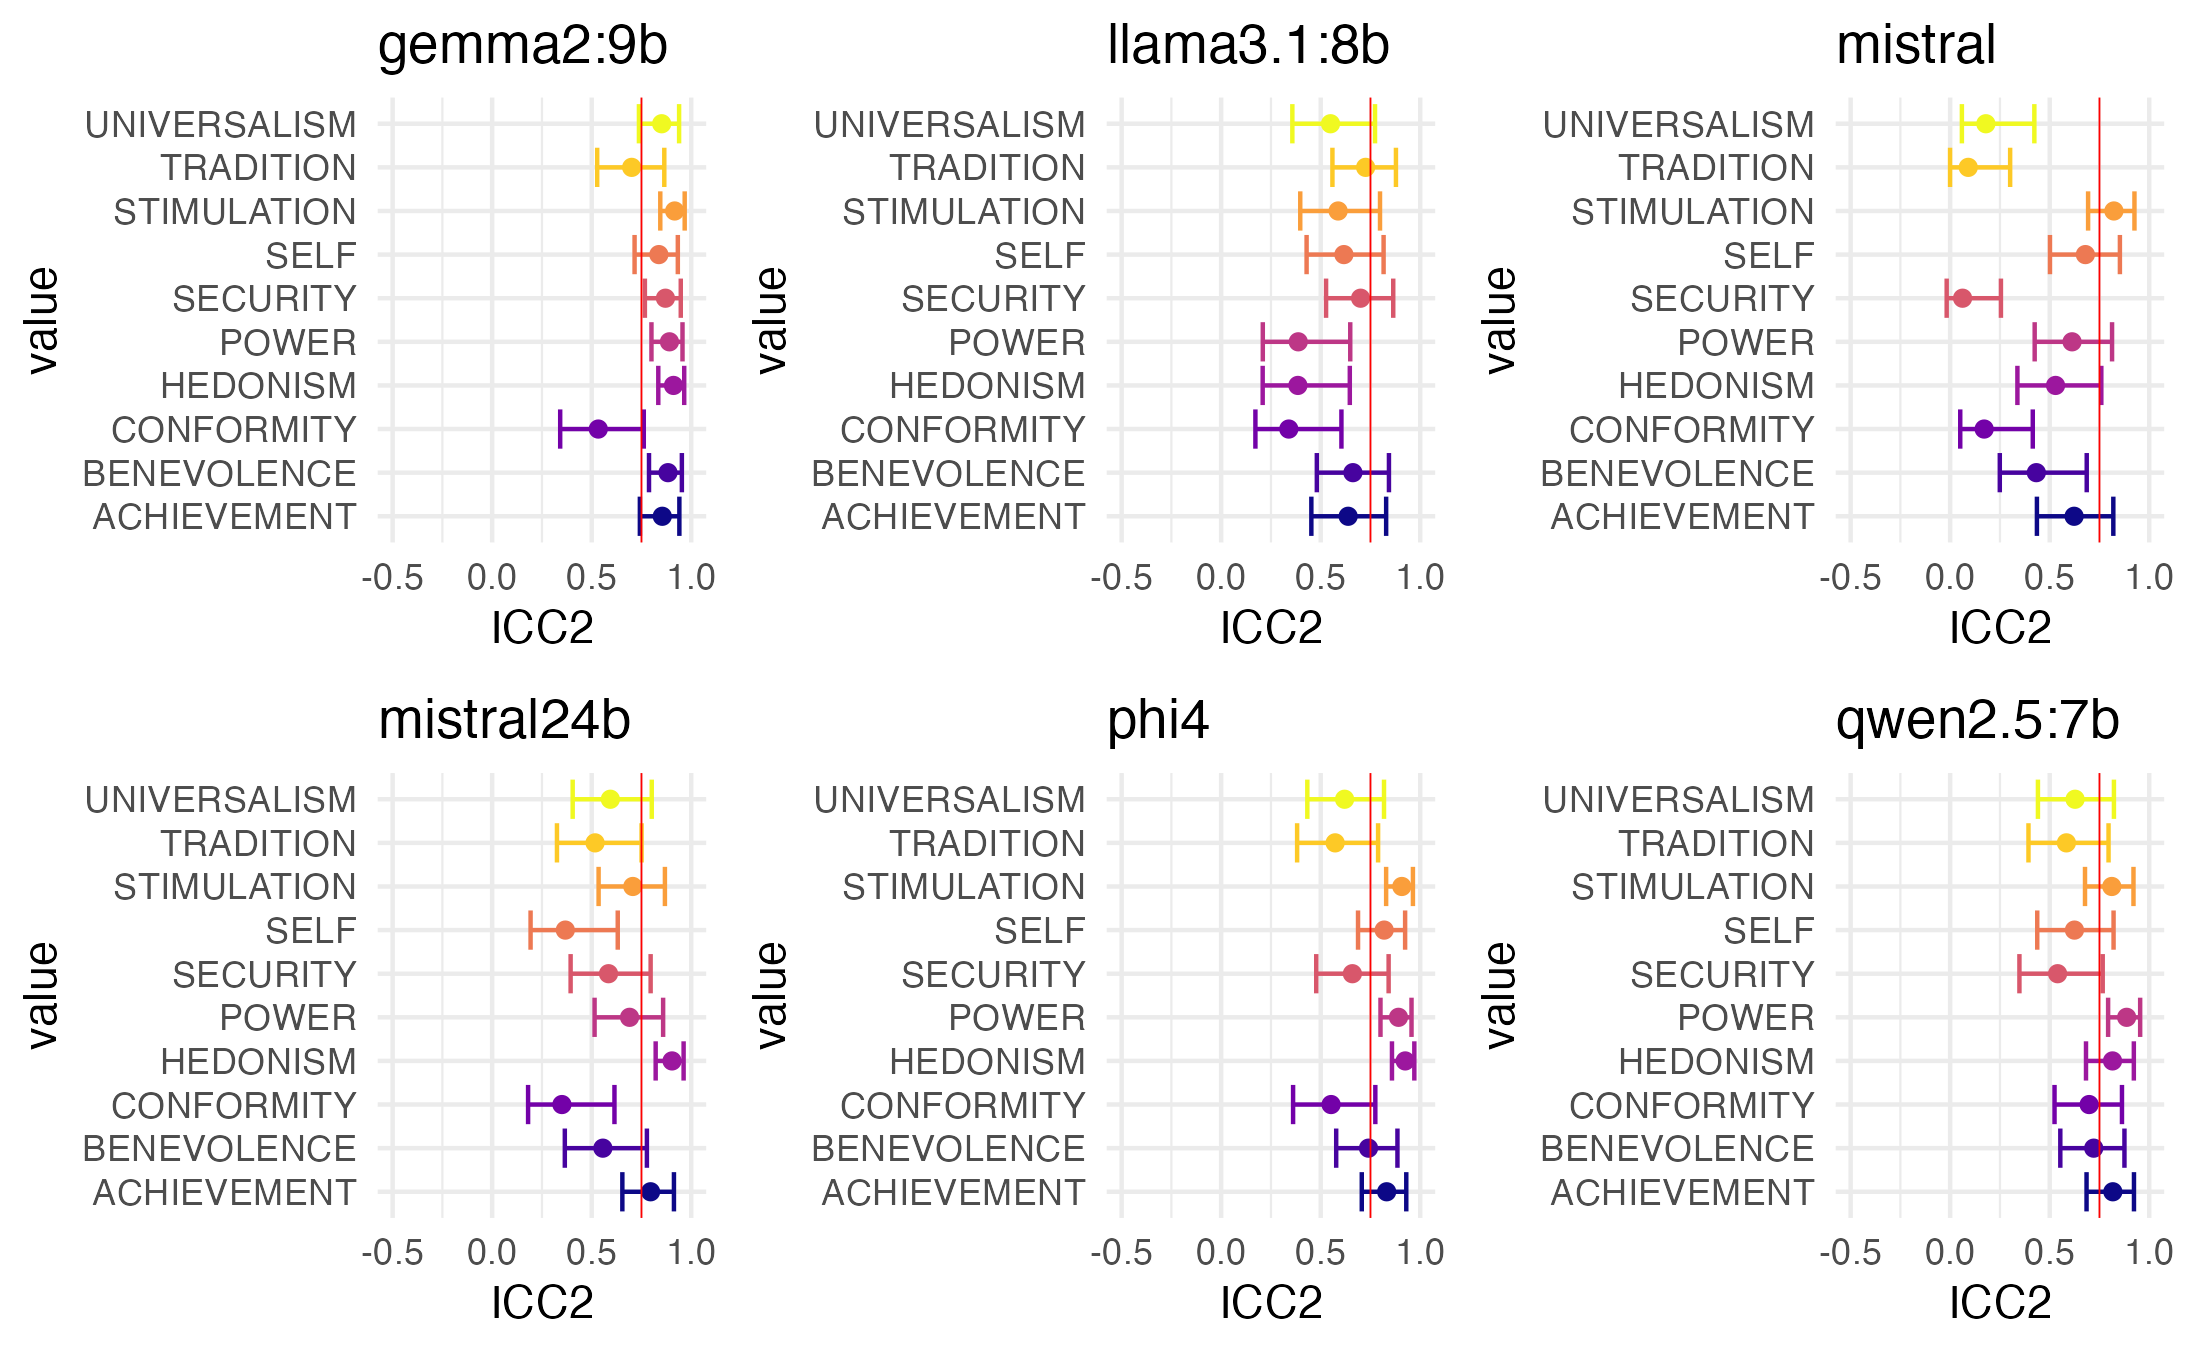
To select a sub-set of models for our primary study, we first ran a pilot. 6 LLMs were selected, and prompted to extract scores of each of the 10 Schwartz values for the 14 song lyrics we used in our pilot.
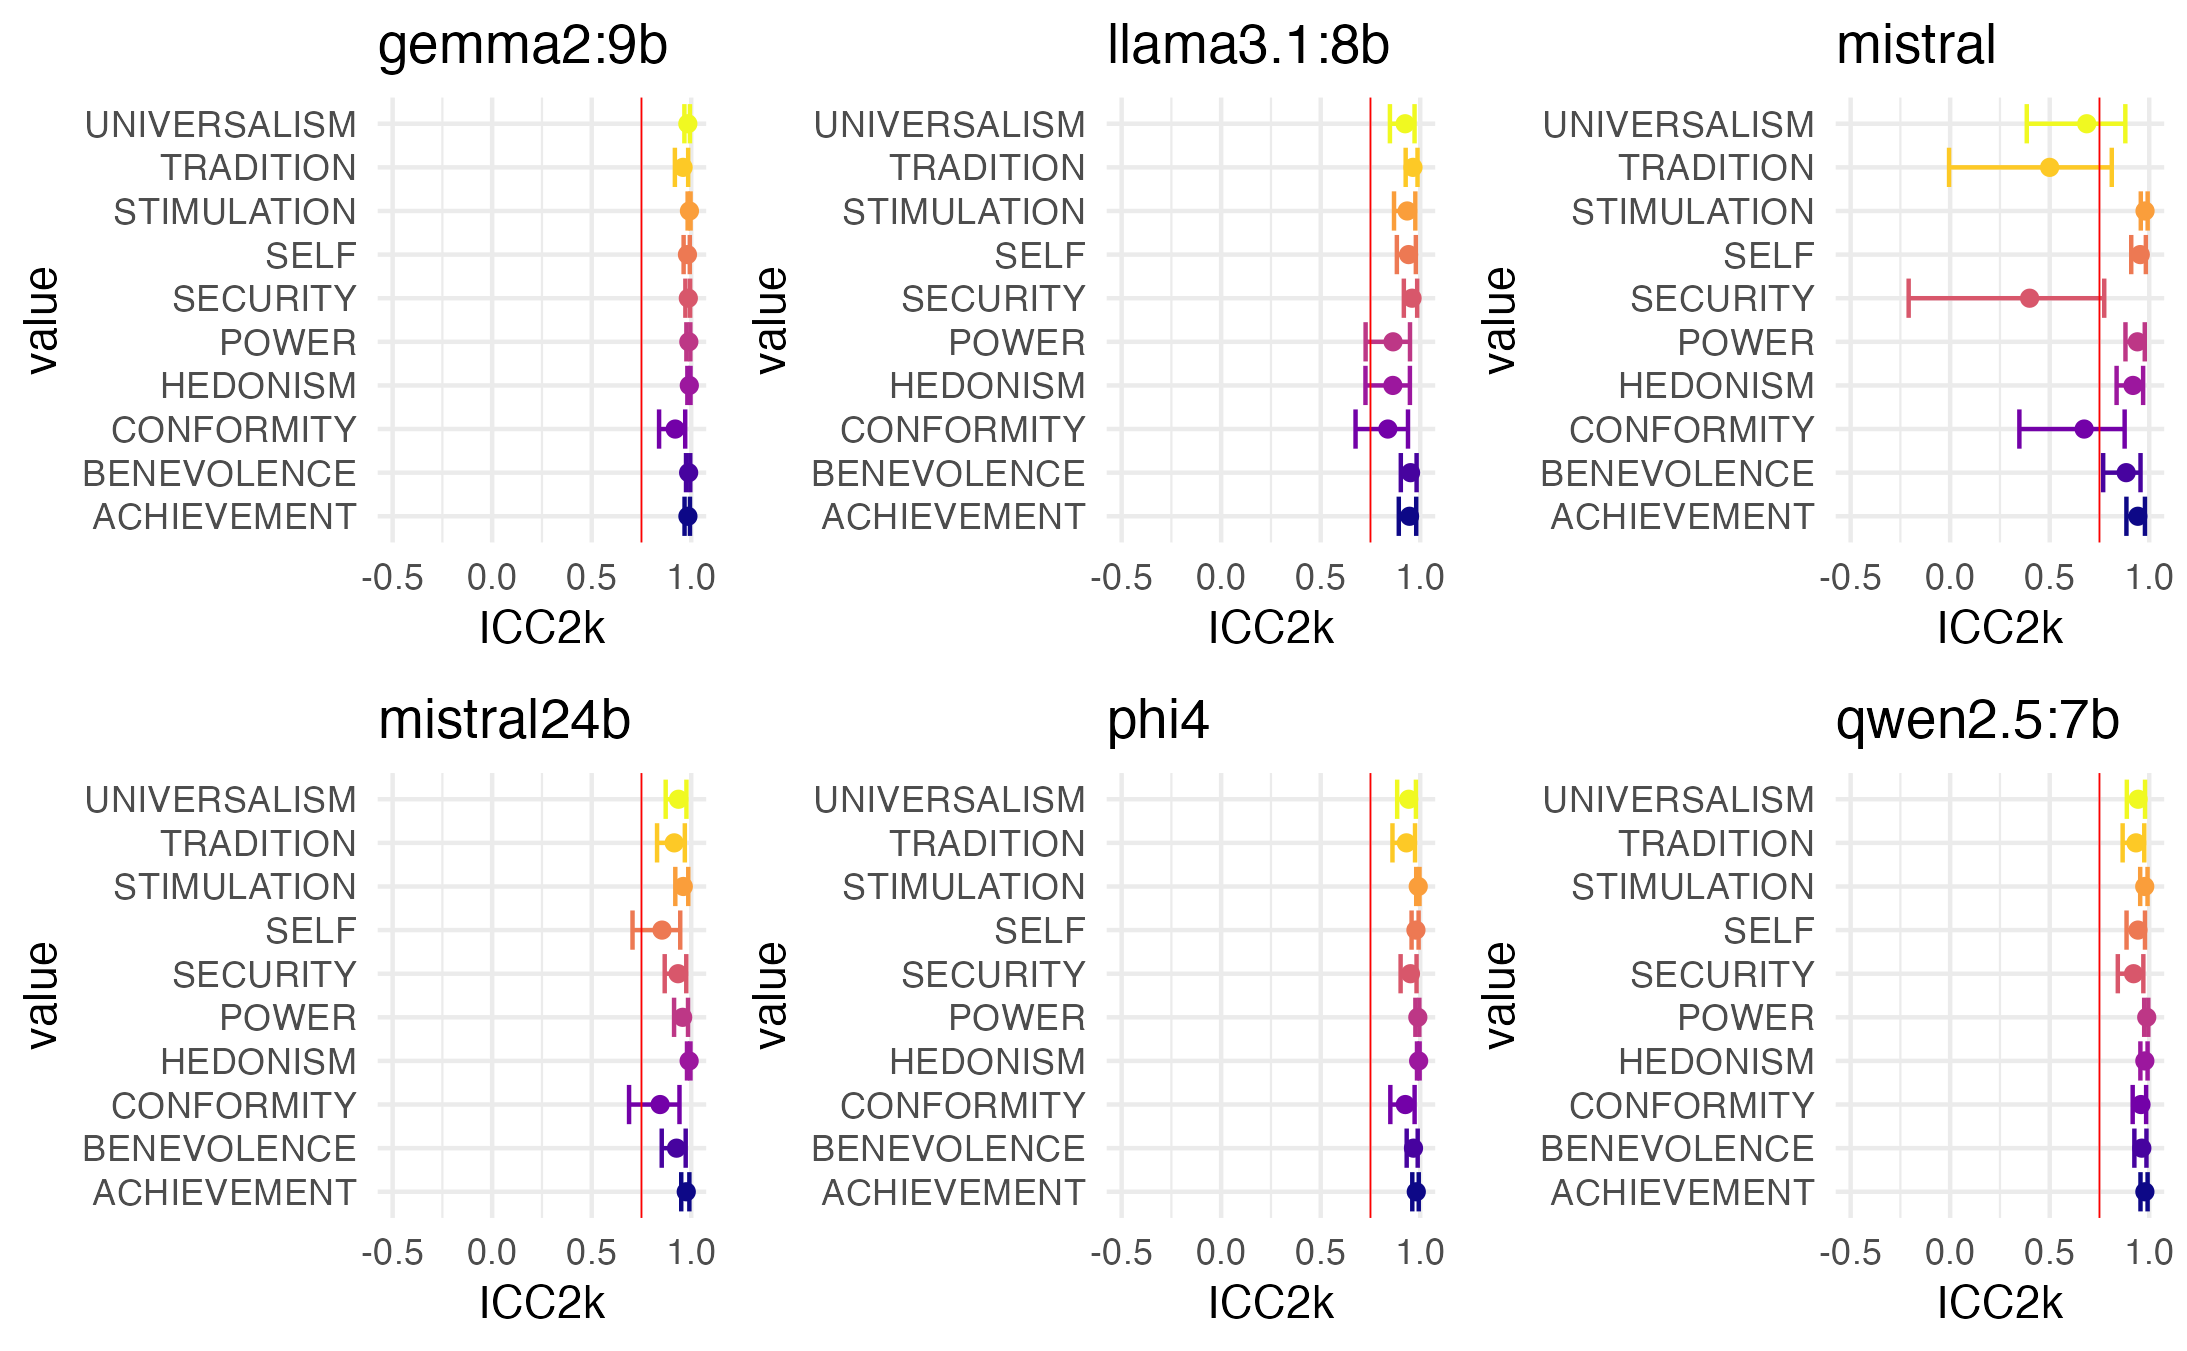
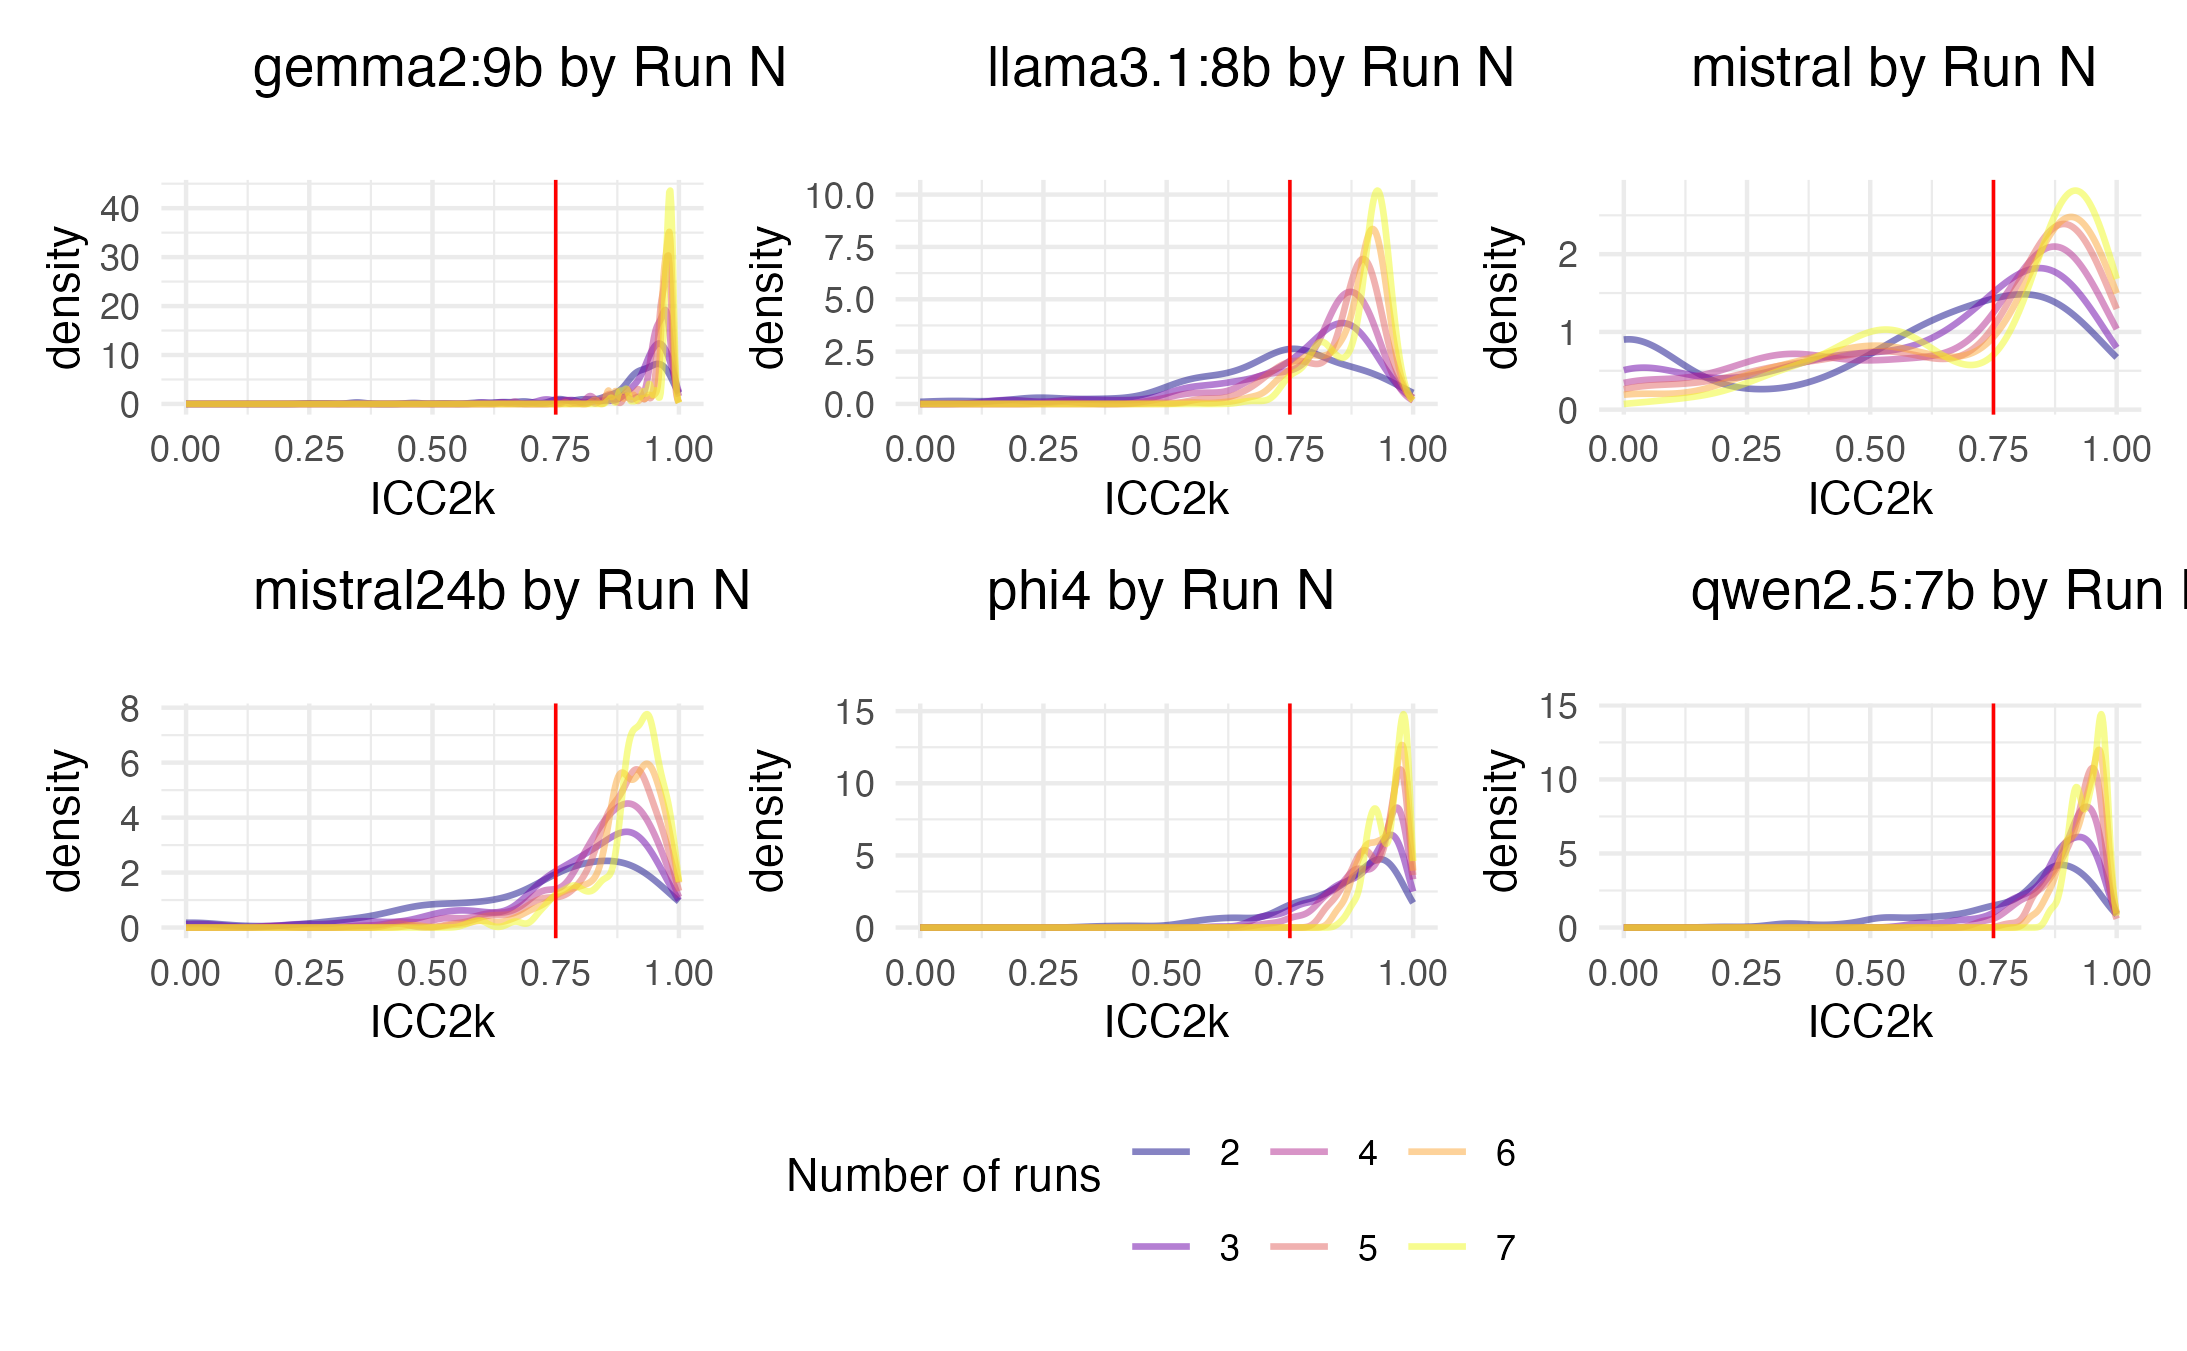
To estimate intra-model reliability, we collected scores from each model 10 times, and estimated intra-class coefficients, type 2. Although our primary analysis involves type 2k, where the expectation is that the estimand is the mean of ratings from several raters selected from a population of raters, we also estimated type 2, where the estimand is one of absolute agreement rather than general consensus.
Type 2 gives us an idea of how much the individual ratings agree. Although they approach the typical threshold of .75 for most values in some of the models, they largely fail. We thus conclude we will likely need multiple runs per model.
We see most models achieve above threshold reliability with 10 runs, in terms of absolute agreement (ICC2), and certainly with general consensus (ICC2k).
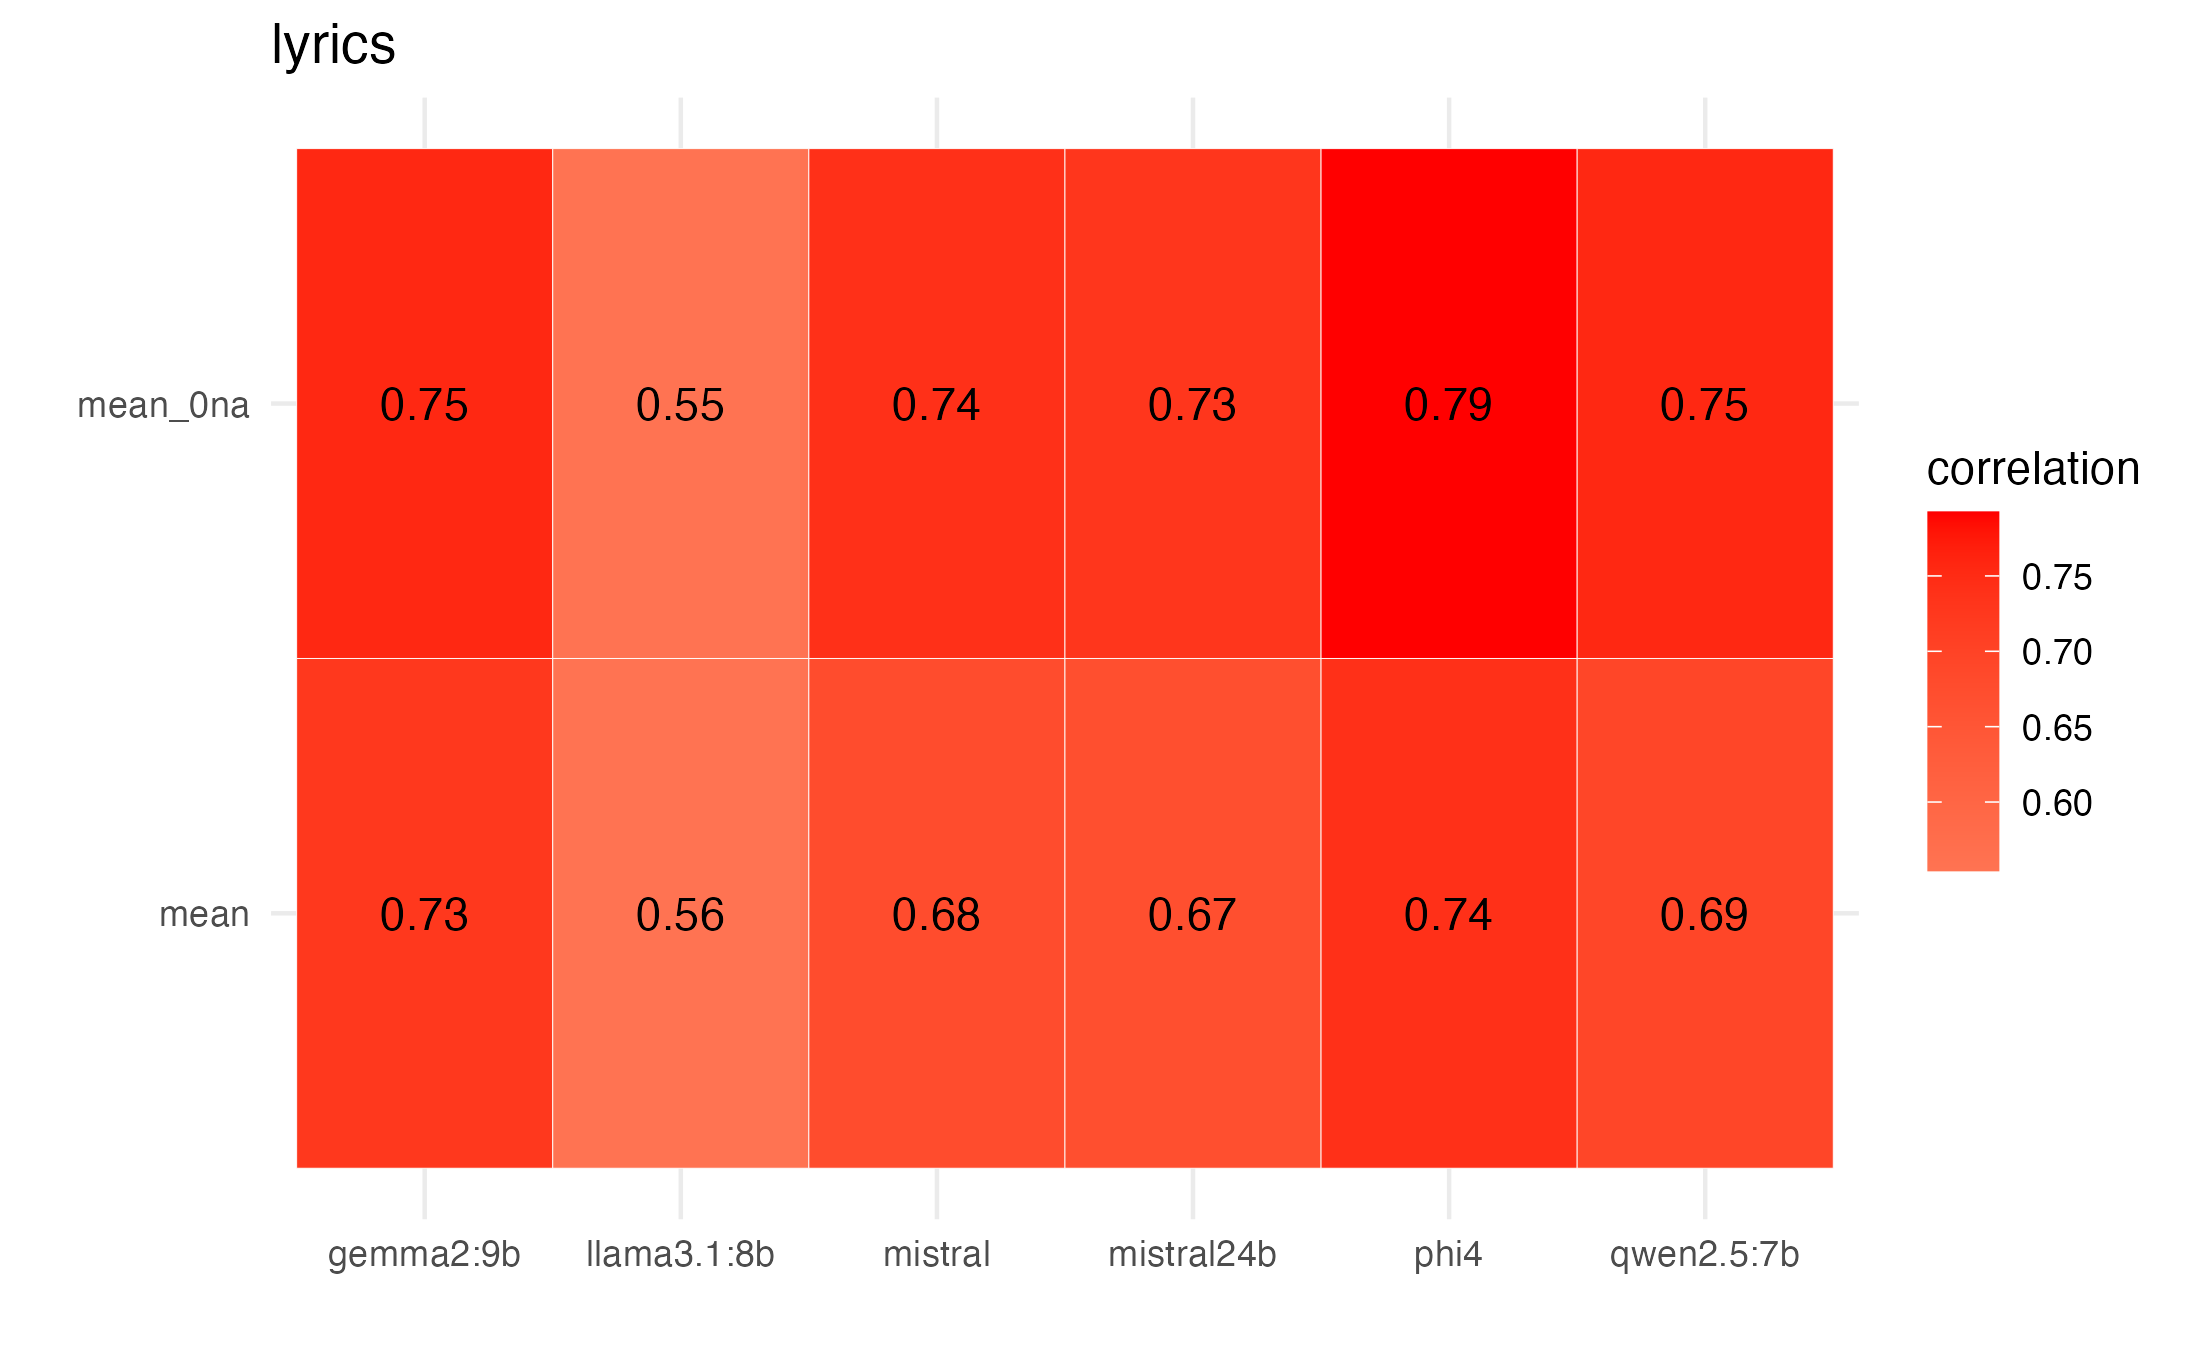
We computed means from participants in two ways. As discussed in the paper, we could leave “NA” responses in the survey as they are, or convert them to 0s. Correlations in the pilot data seem very similar independent of approach.
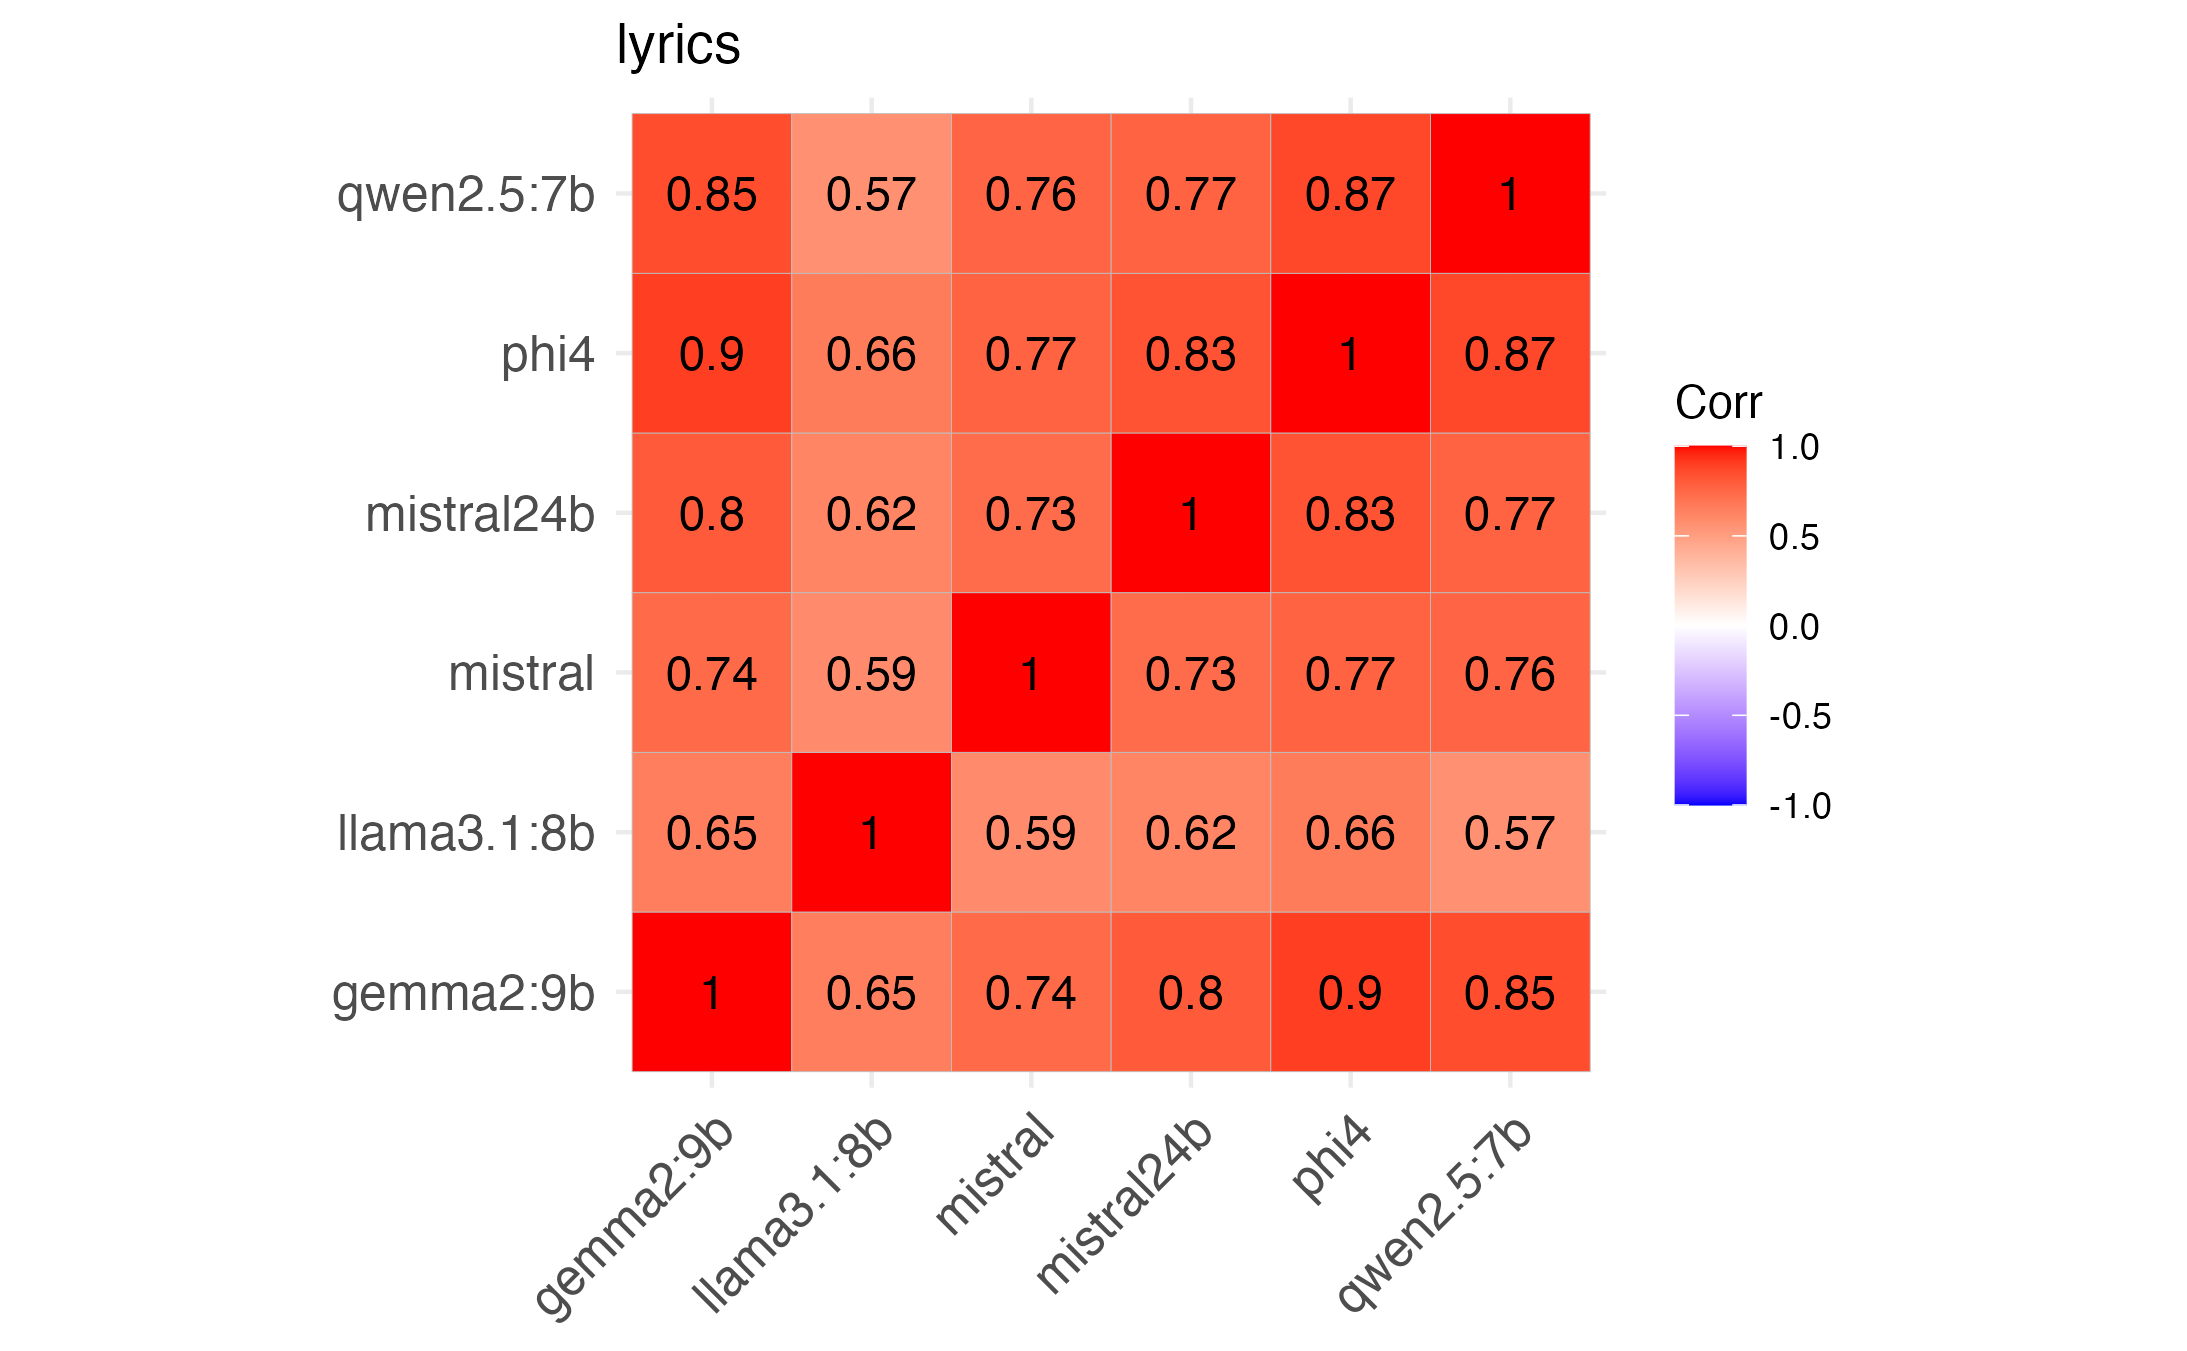
We also examine correlations by value. We see moderate to high correlations overall, with gemma showing most correlations above .8. We see similar results if we treat “NA” values as ’0’s.
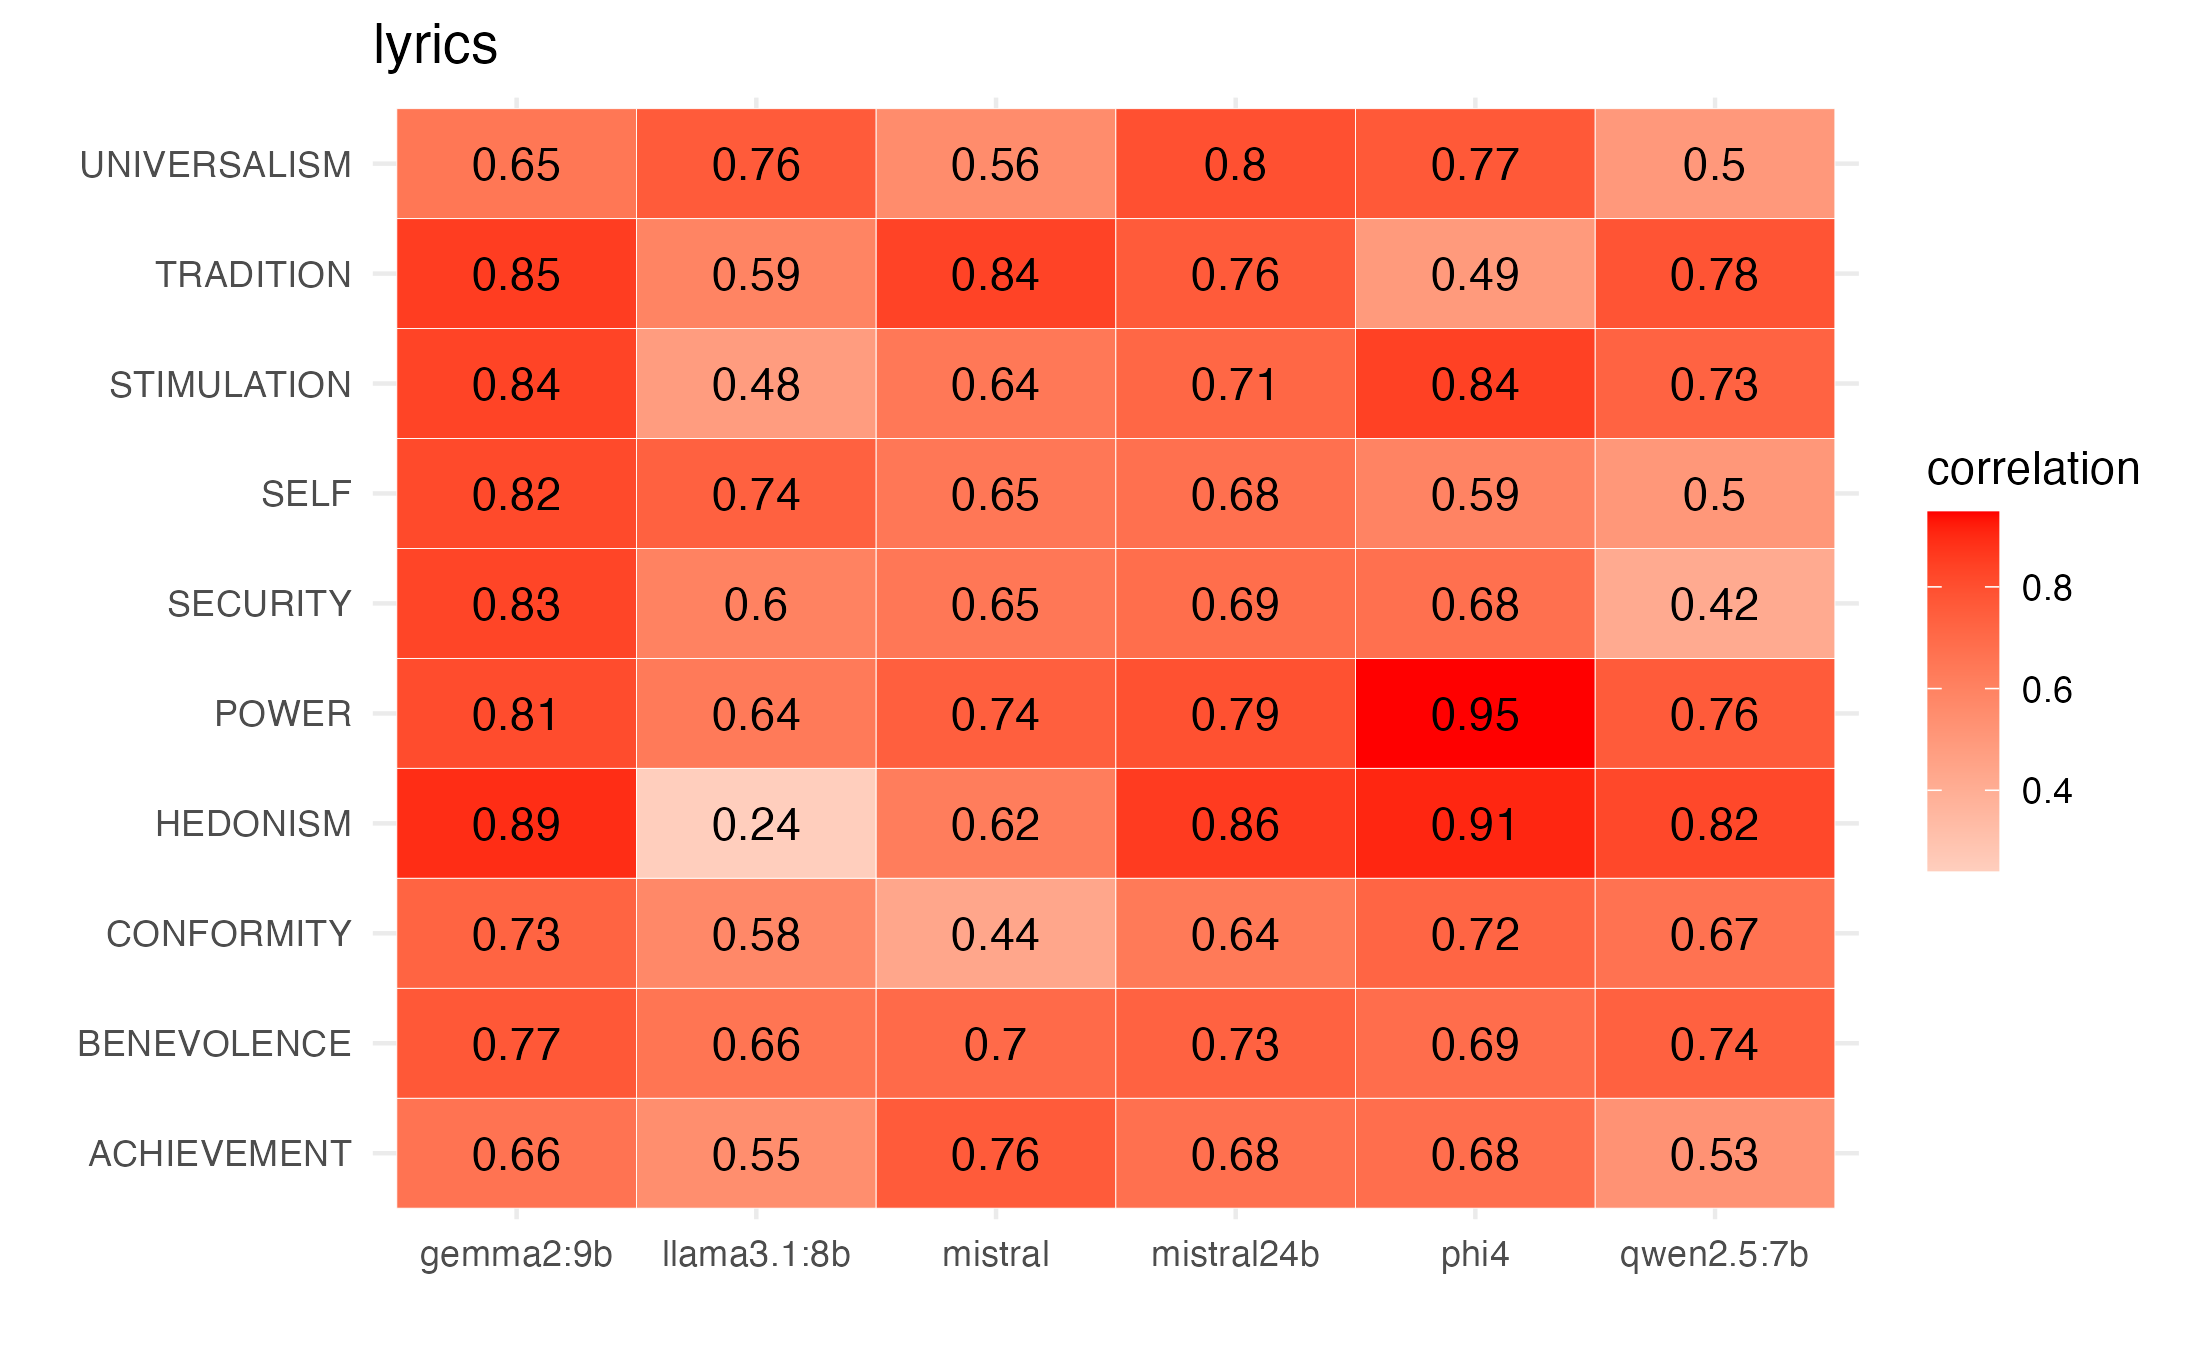
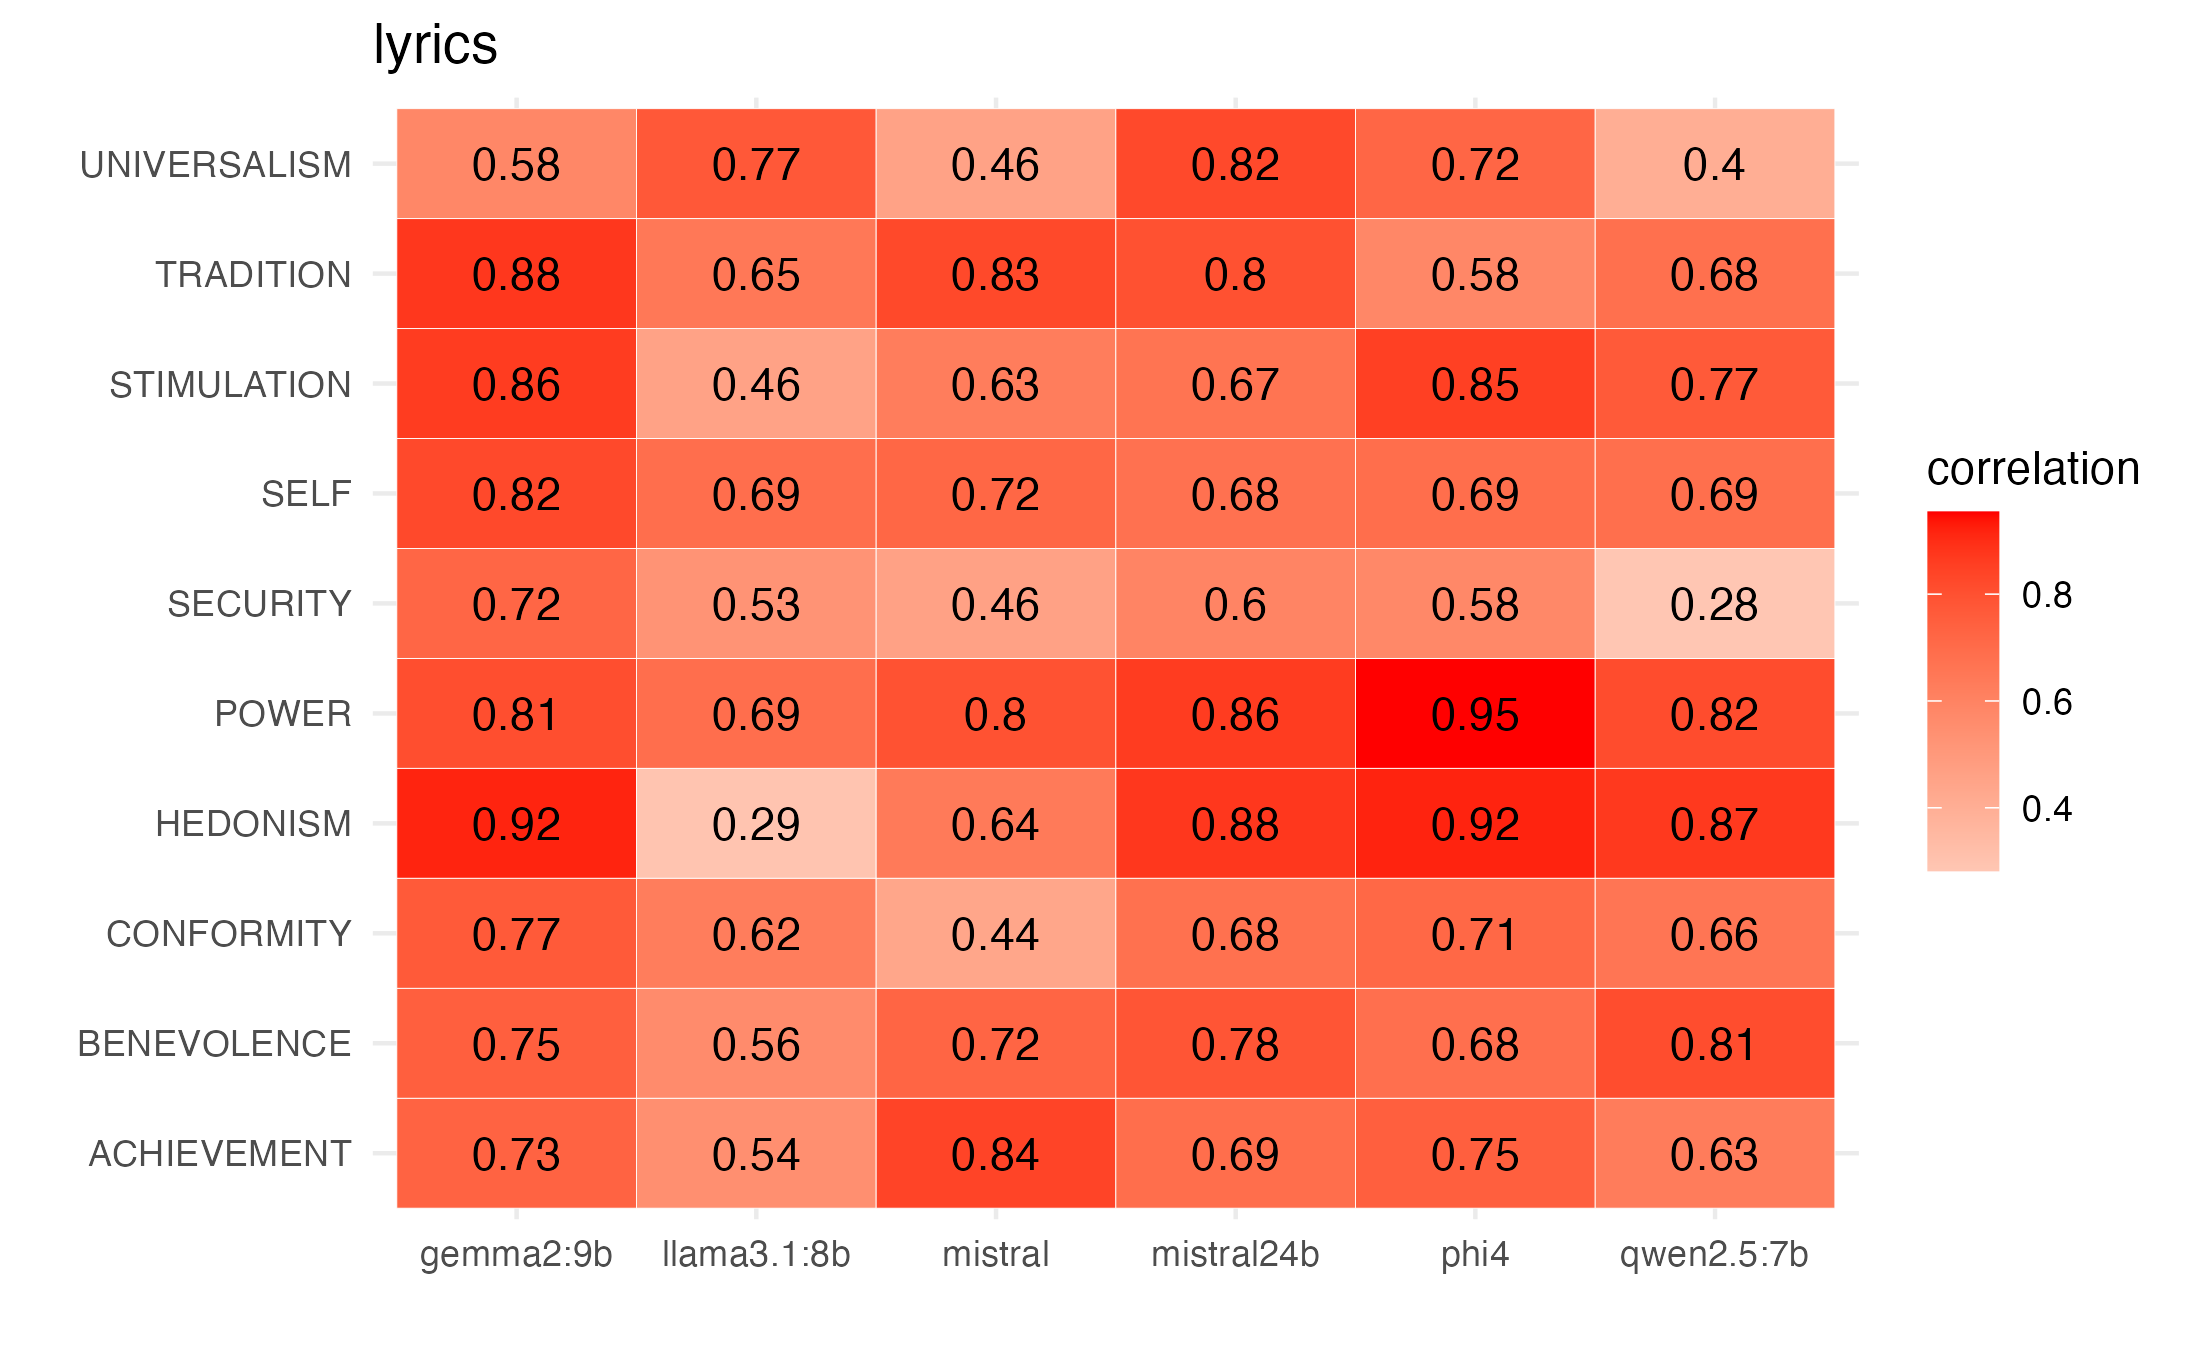
To determine which models to use and the number of runs we take a bootstrap approach (see paper for description). We observe that gemma, phi, and qwen seem to reach appropriate levels of reliability in about 3 runs, and show relatively high correlations with mean scores from participants ratings.
Main Study: LLM correlations with Participant ratings
Our main study presents results using 400 song lyrics. We gathered a median 15 ratings from participants in the US, stratified by the 4 most common ethnicities. We then compute means per value per song. We then prompt our subset of 3 LLMs to rate each song 3 times per value.
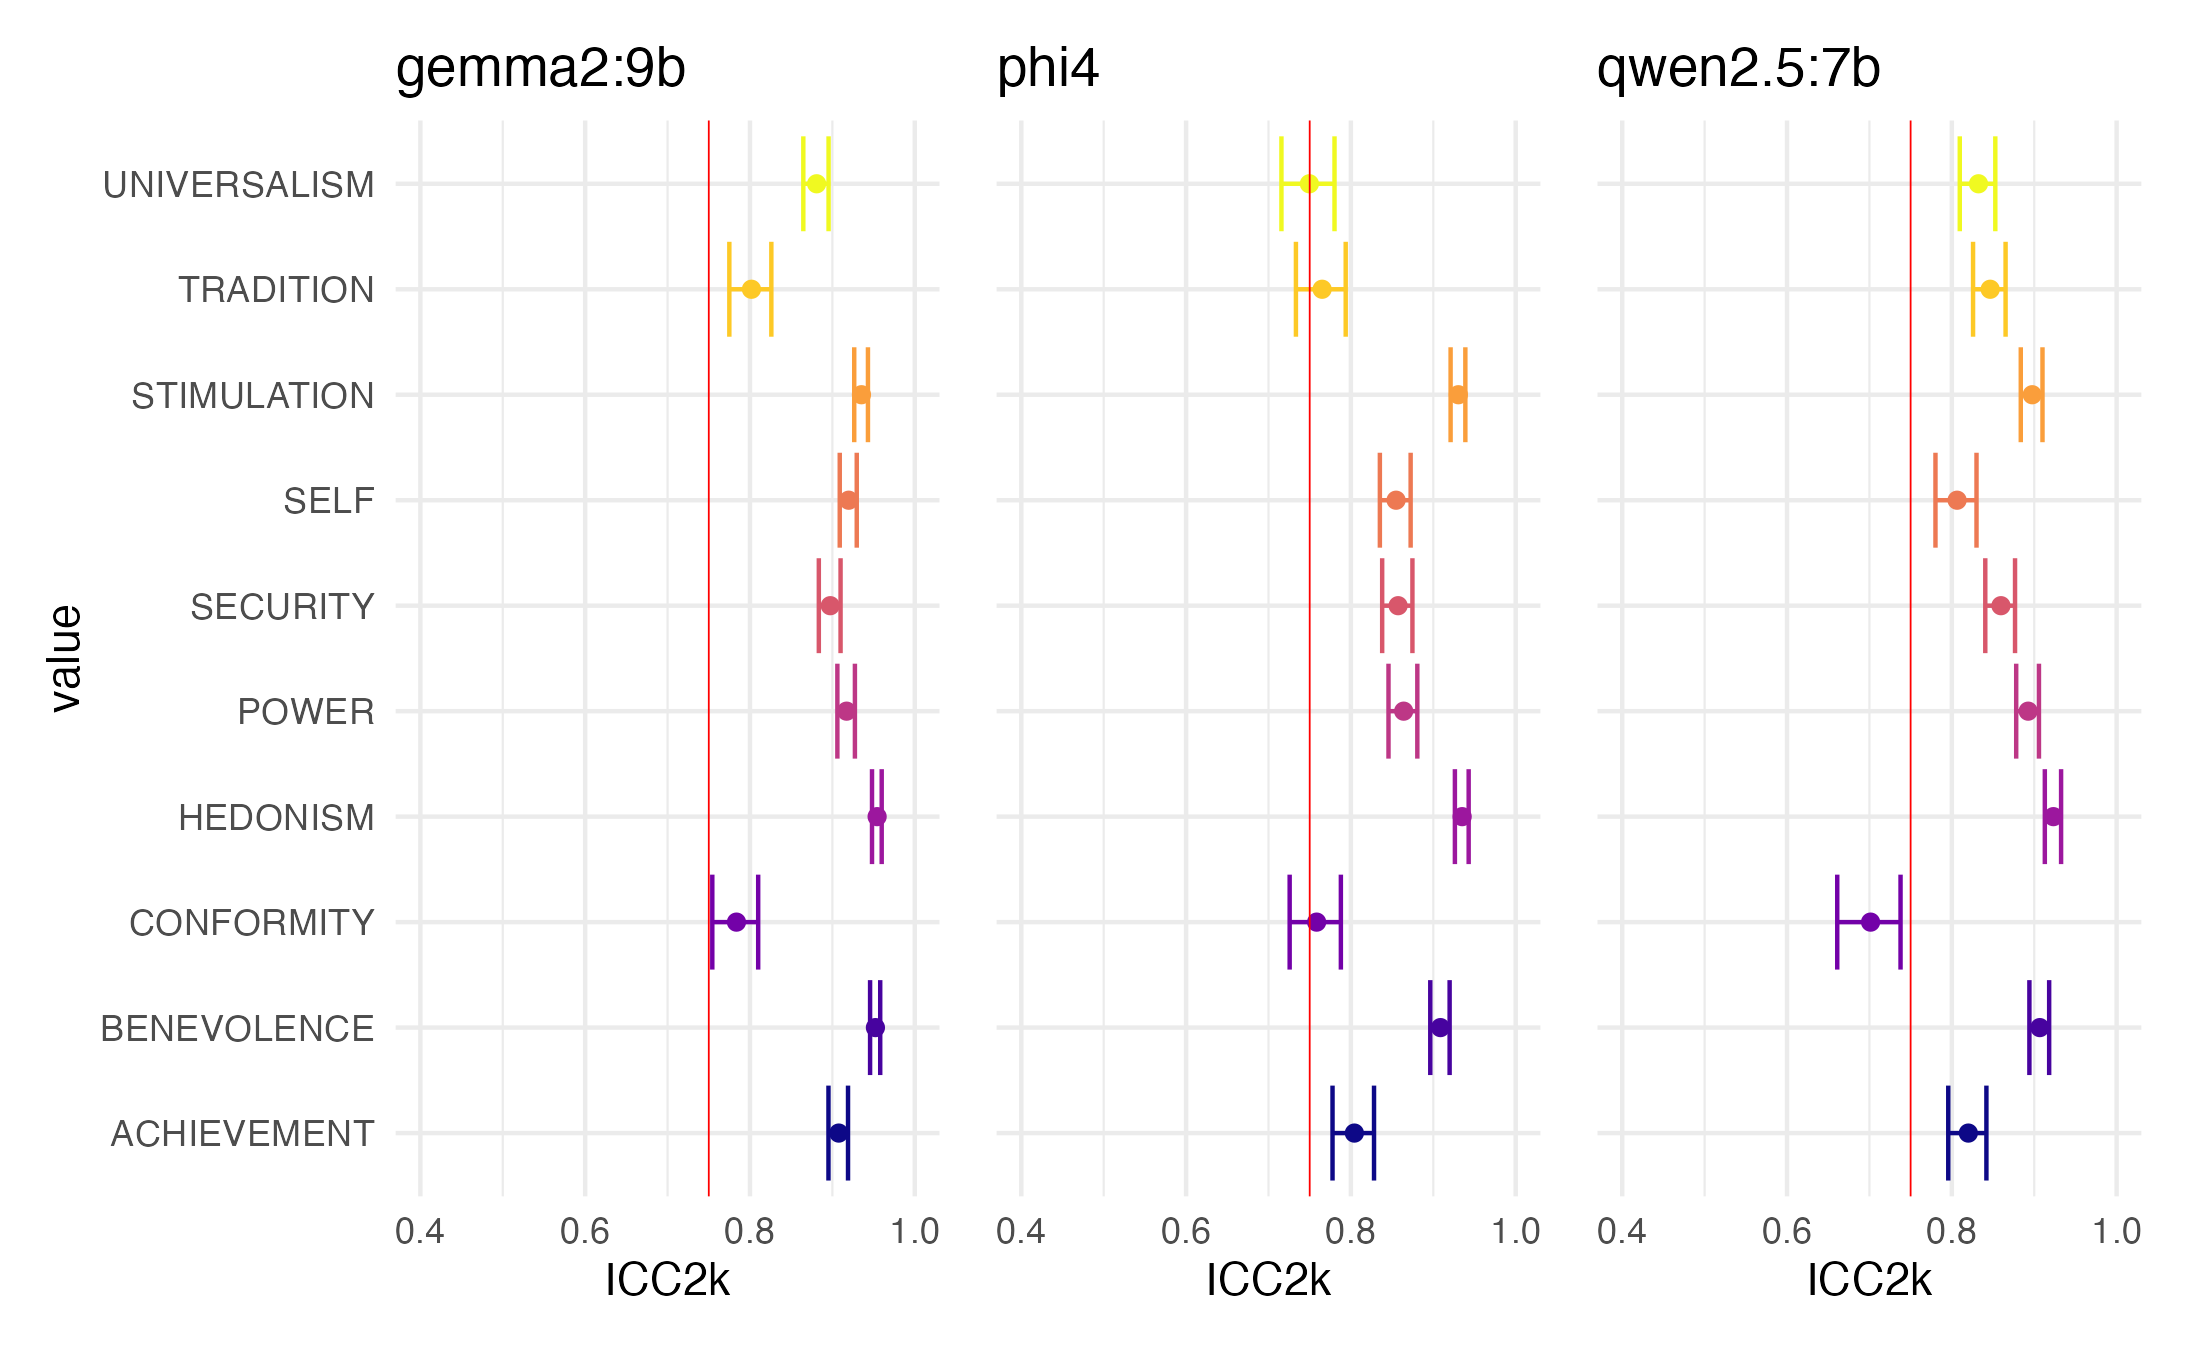
Overall Reliabilies
We first asses the reliability of our subset of LLMs over three runs. Overall we see that the models achieve satisfactory reliability for almost all values, with phi and qwen showing relatively poorer scores on CONFORMITY, and phi scores on UNIVERSALISM.
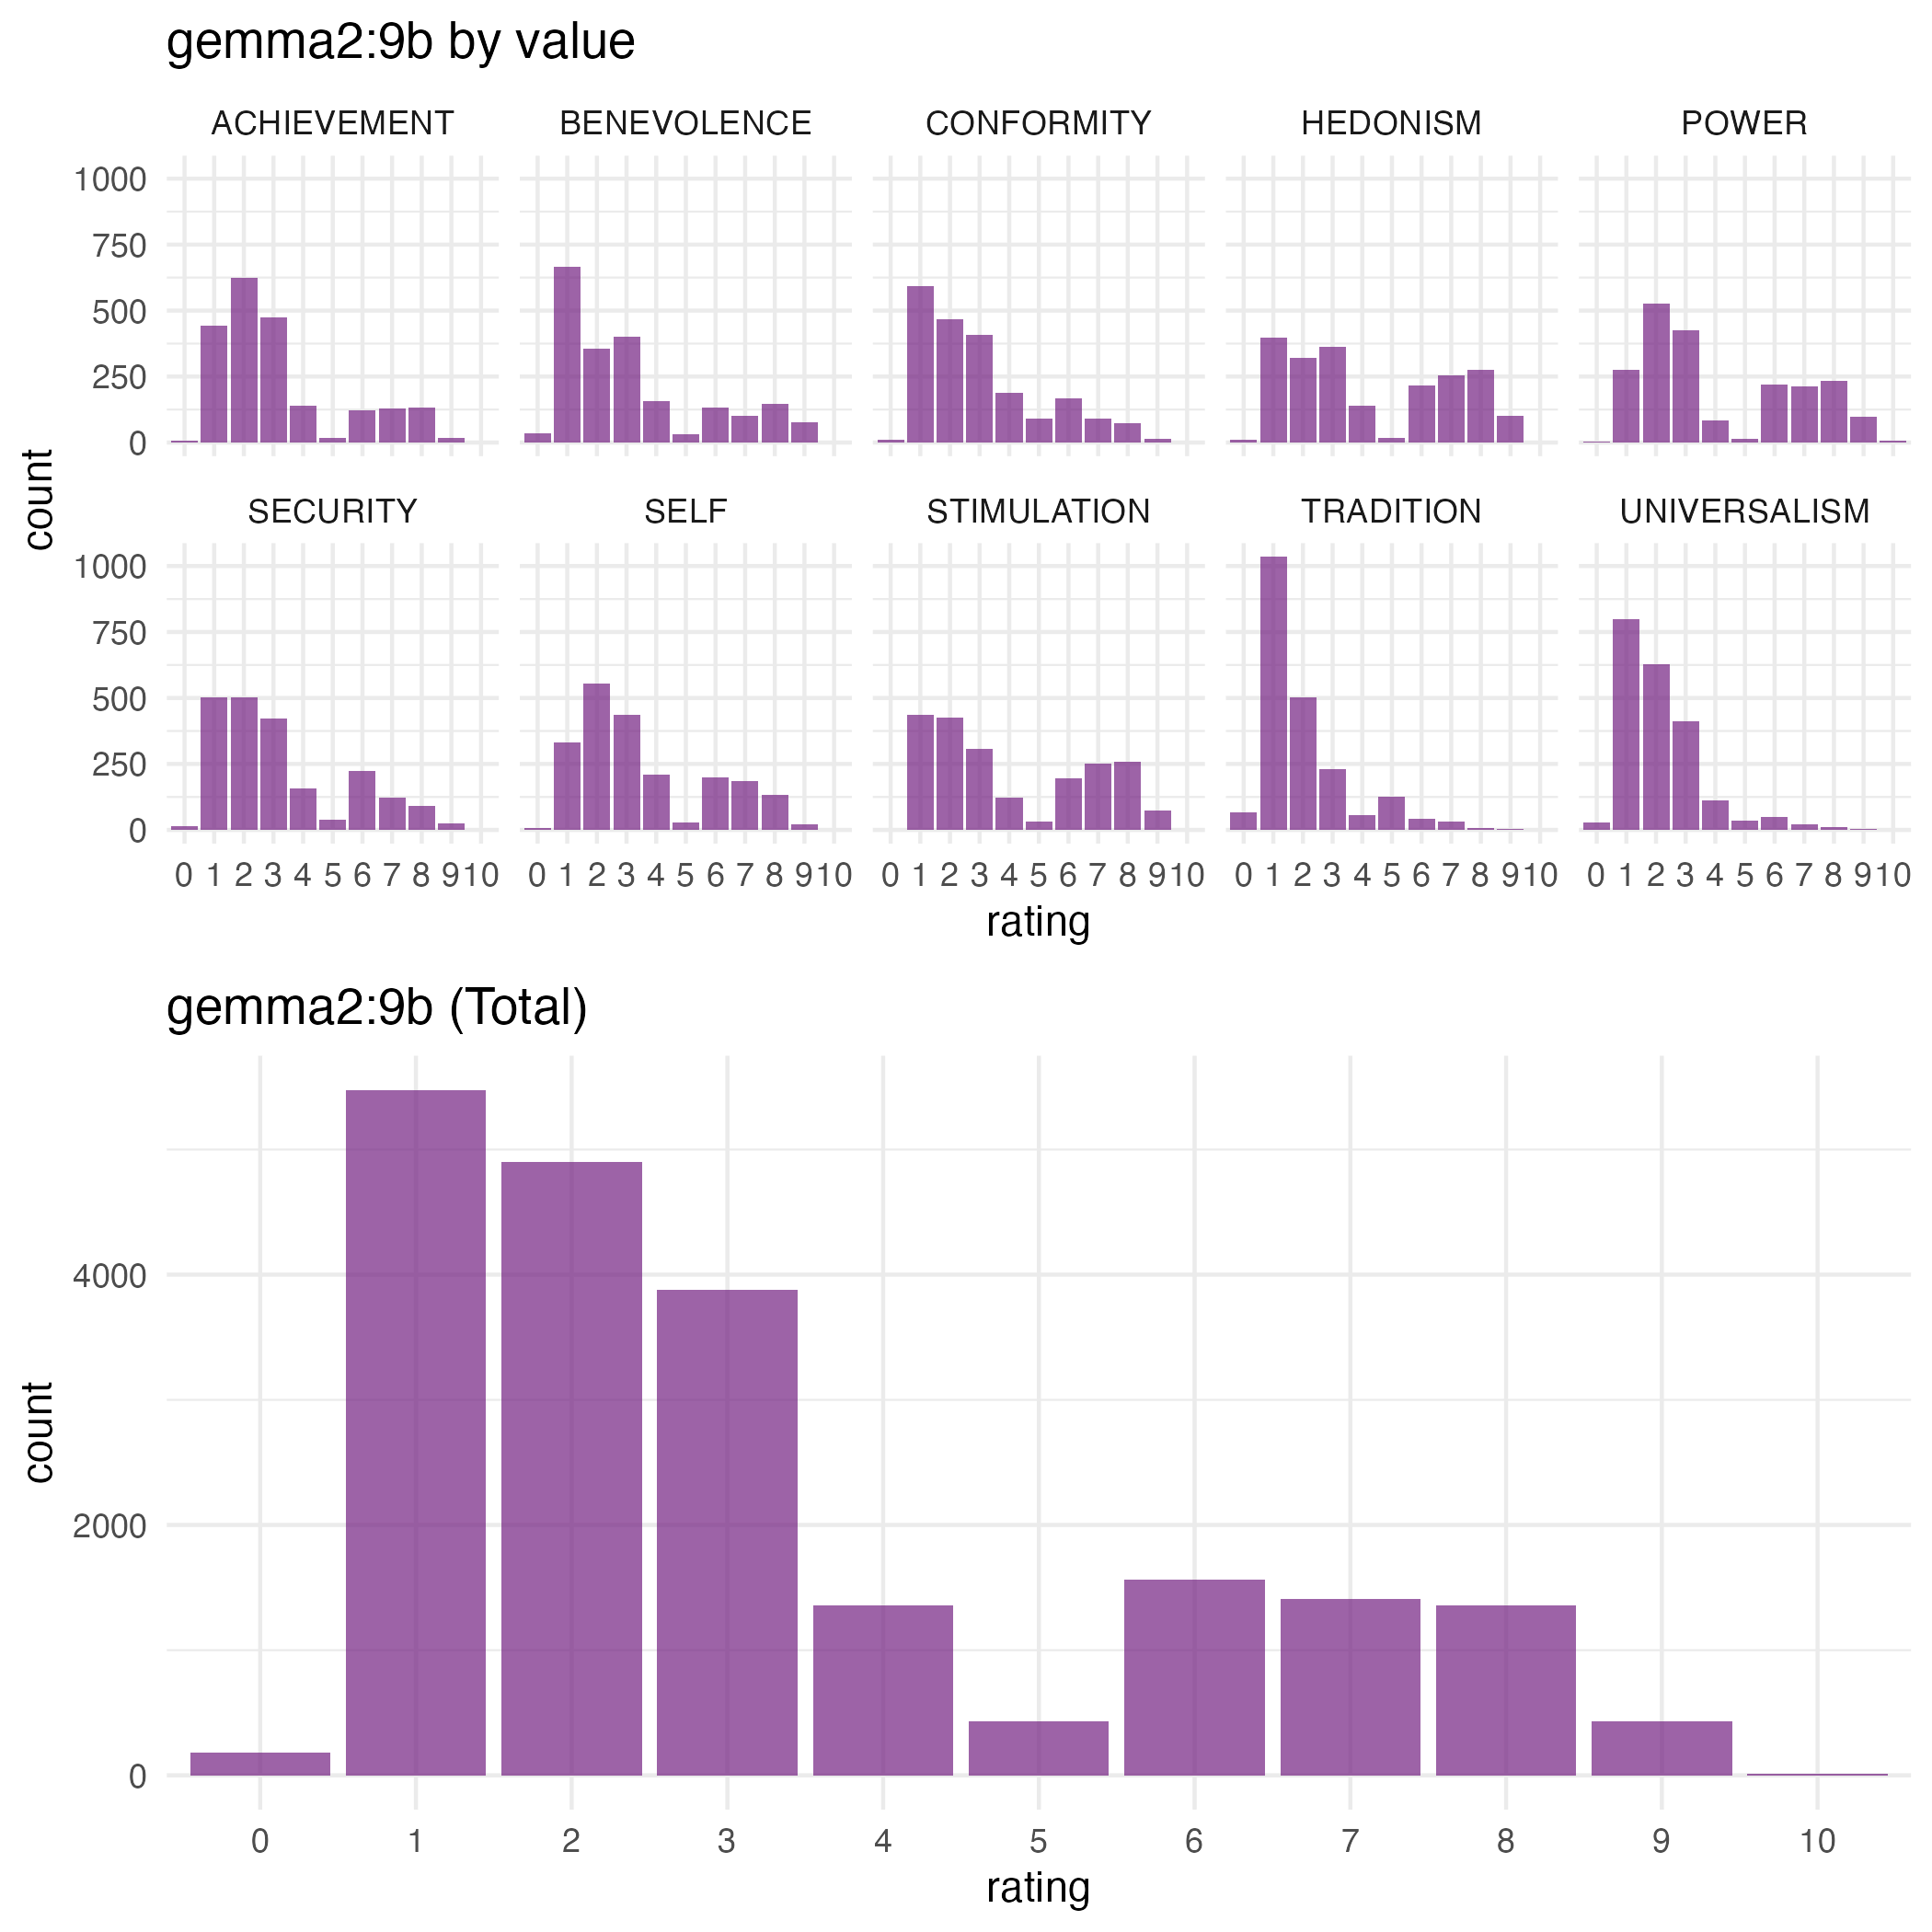
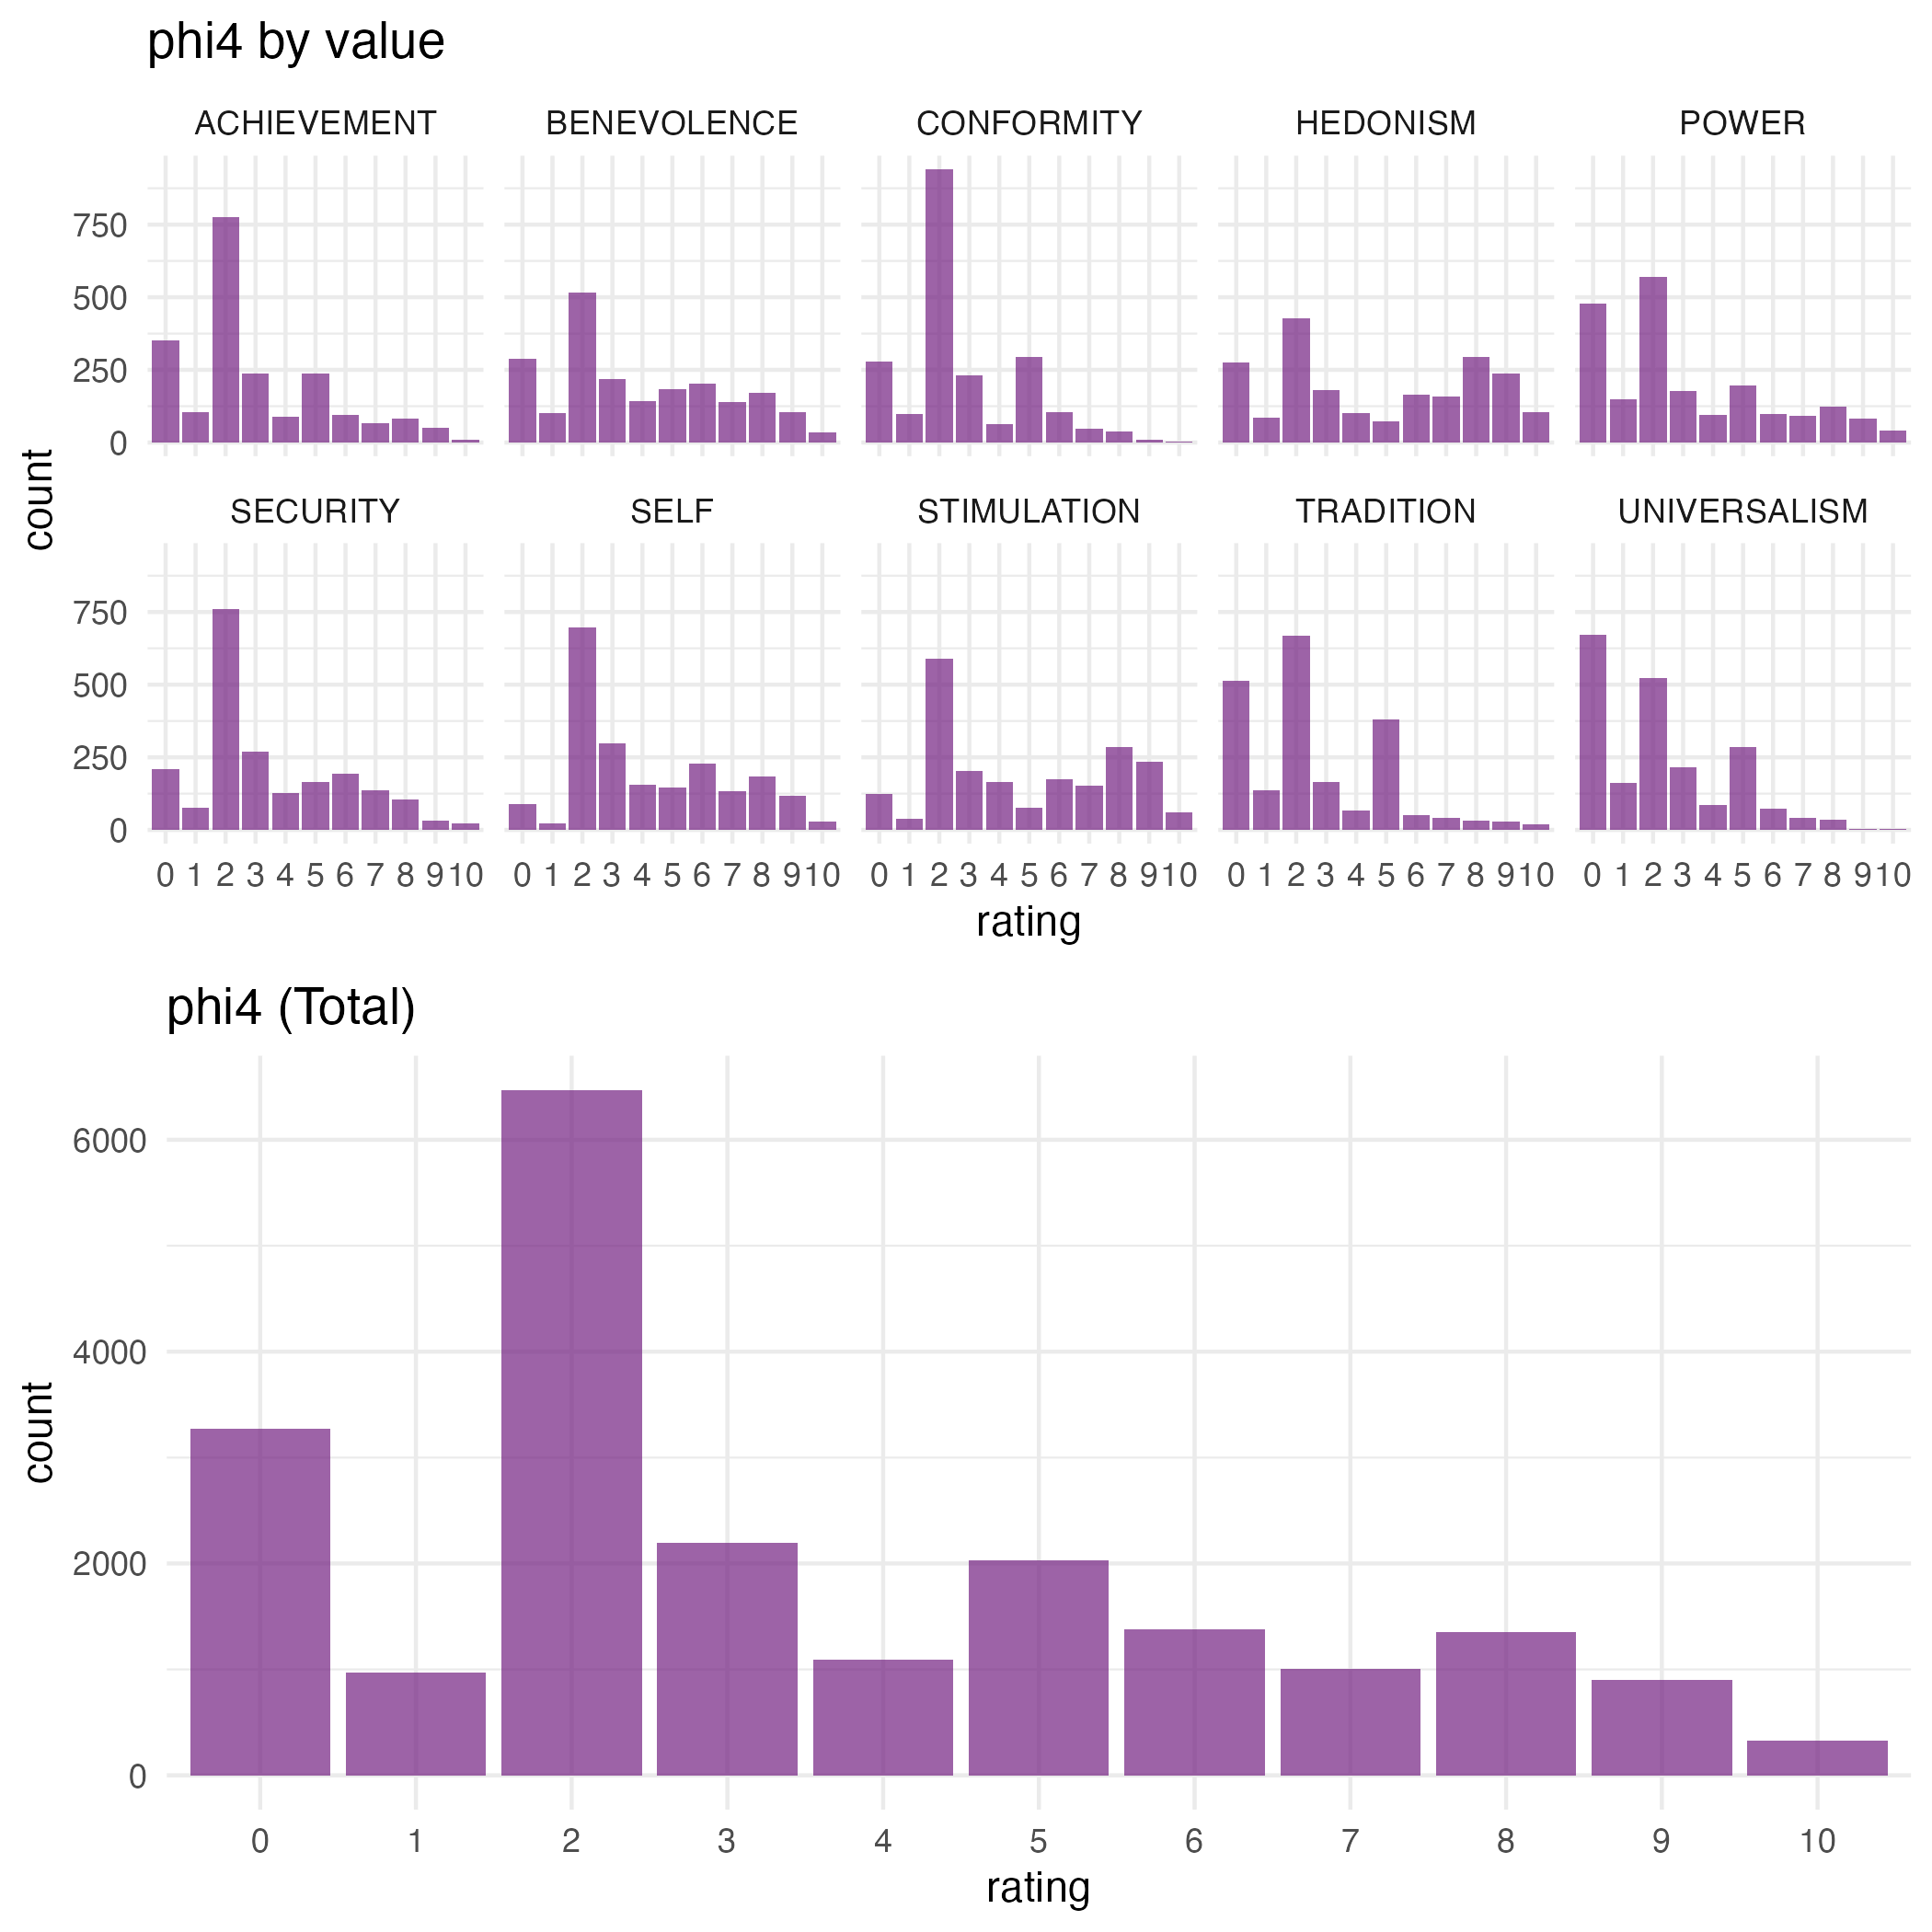
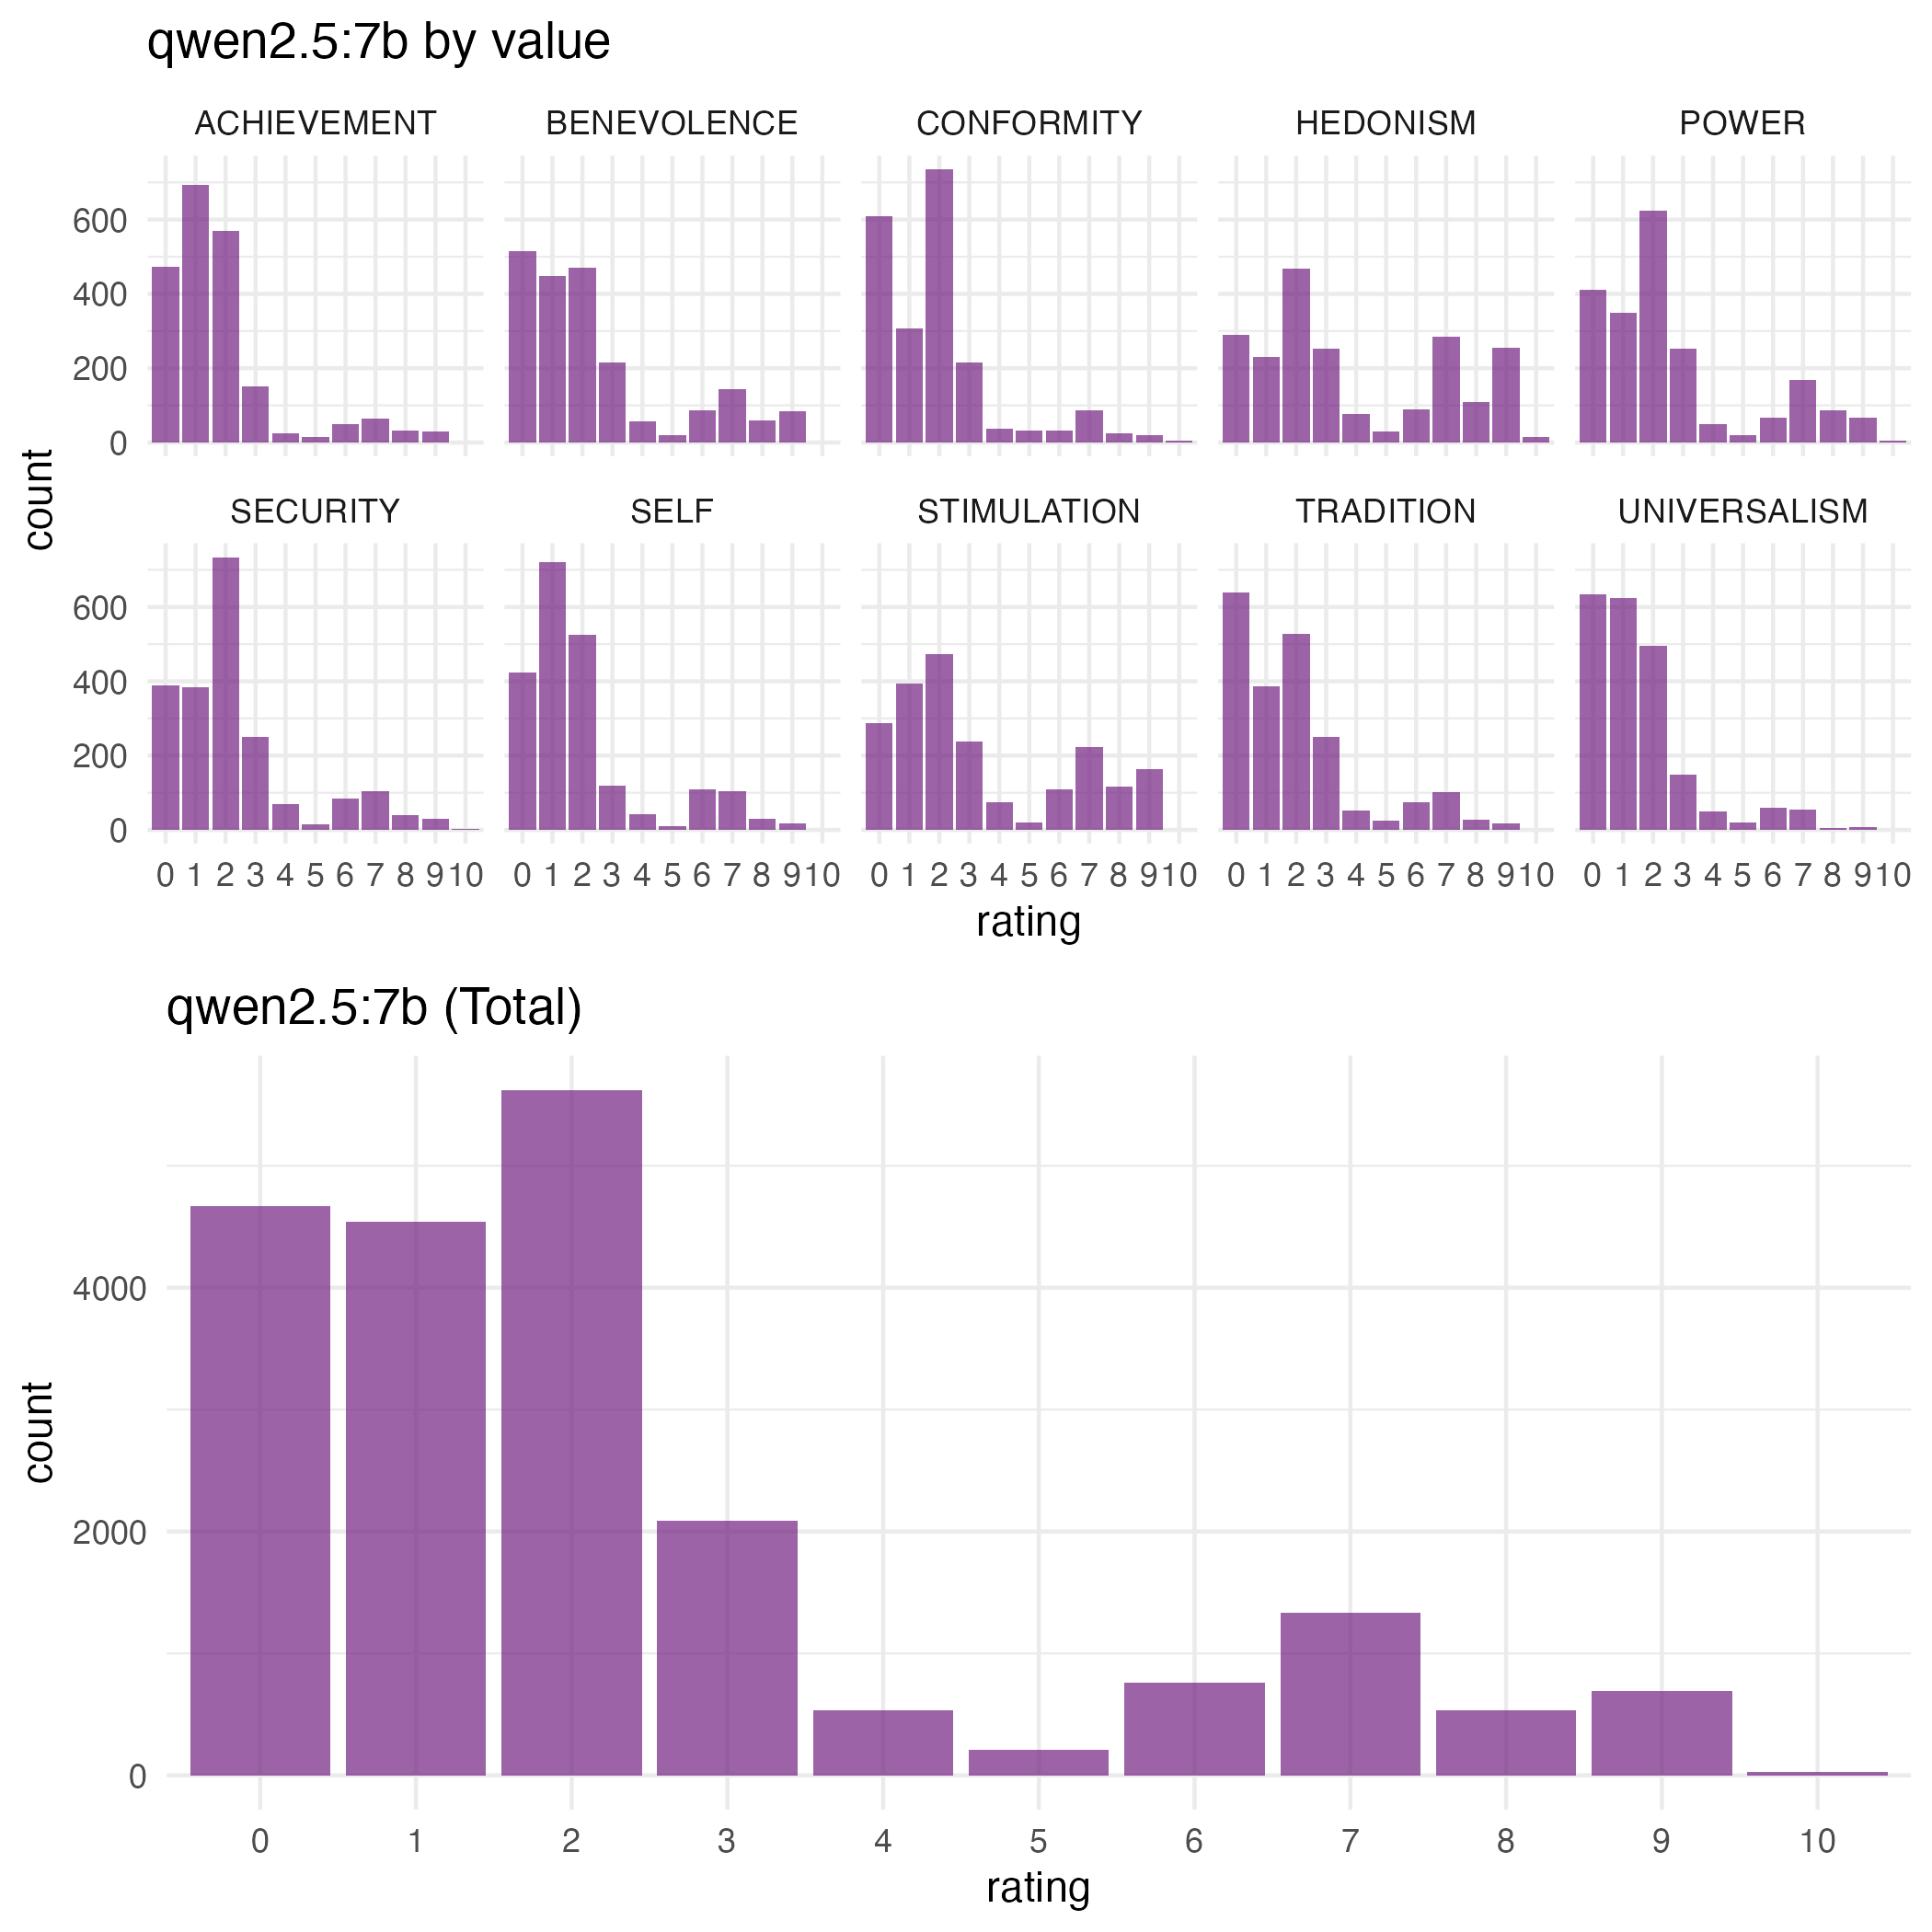
Rating Distributions: LLMs vs. Participants
Participants in our main study often rated values as missing, which makes sense given that lyrics are short snippets, and gaining a complete perspective of the values of the “Speaker” is unlikely.
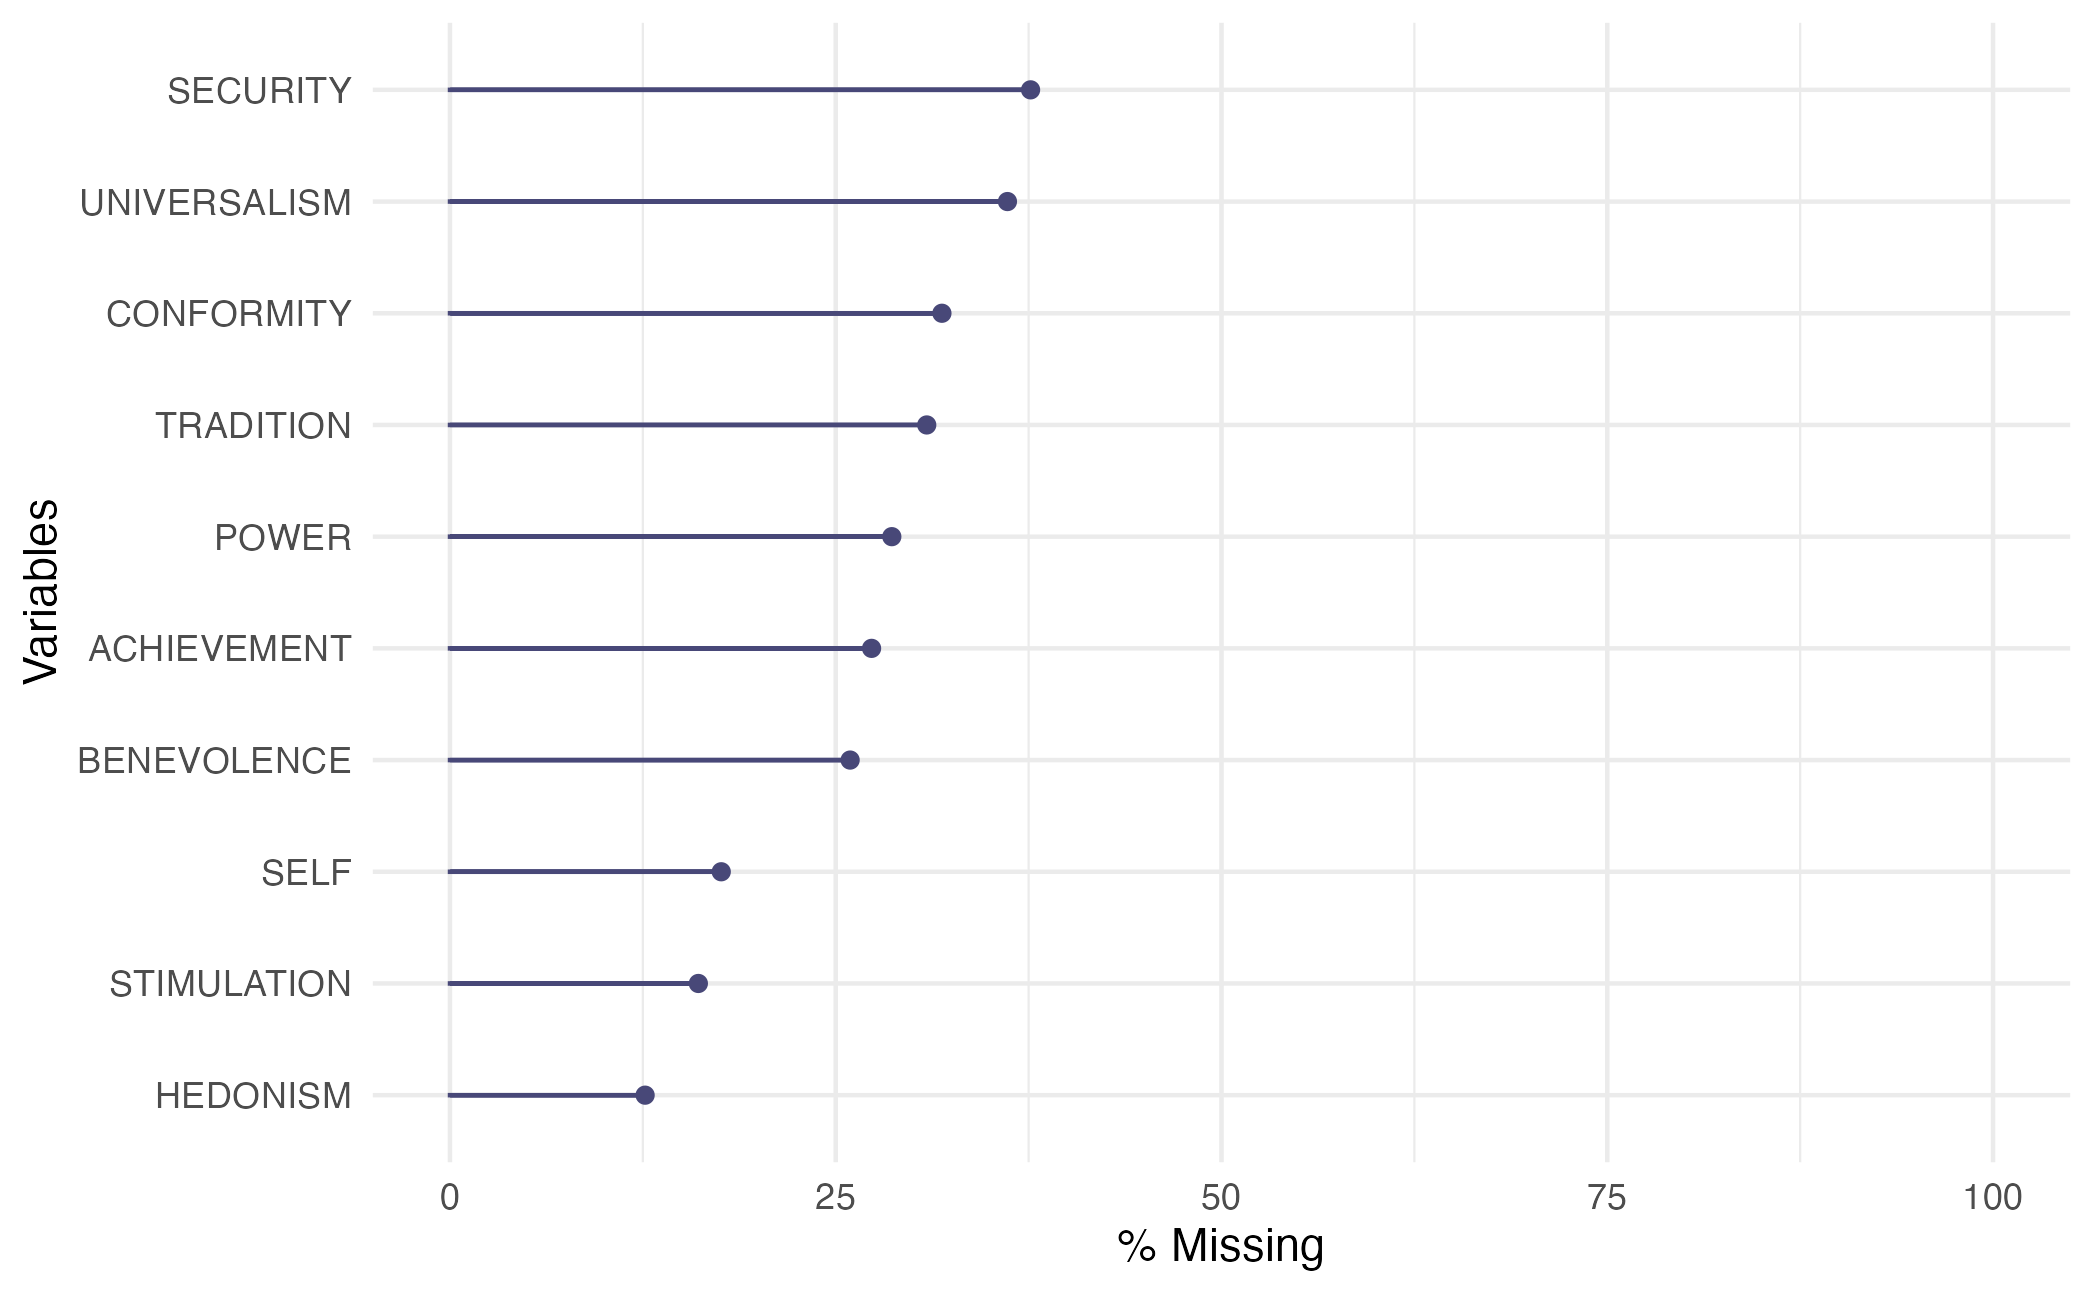 Hedonism, Self-Direction, and Stimulation the lowest number of NAs.
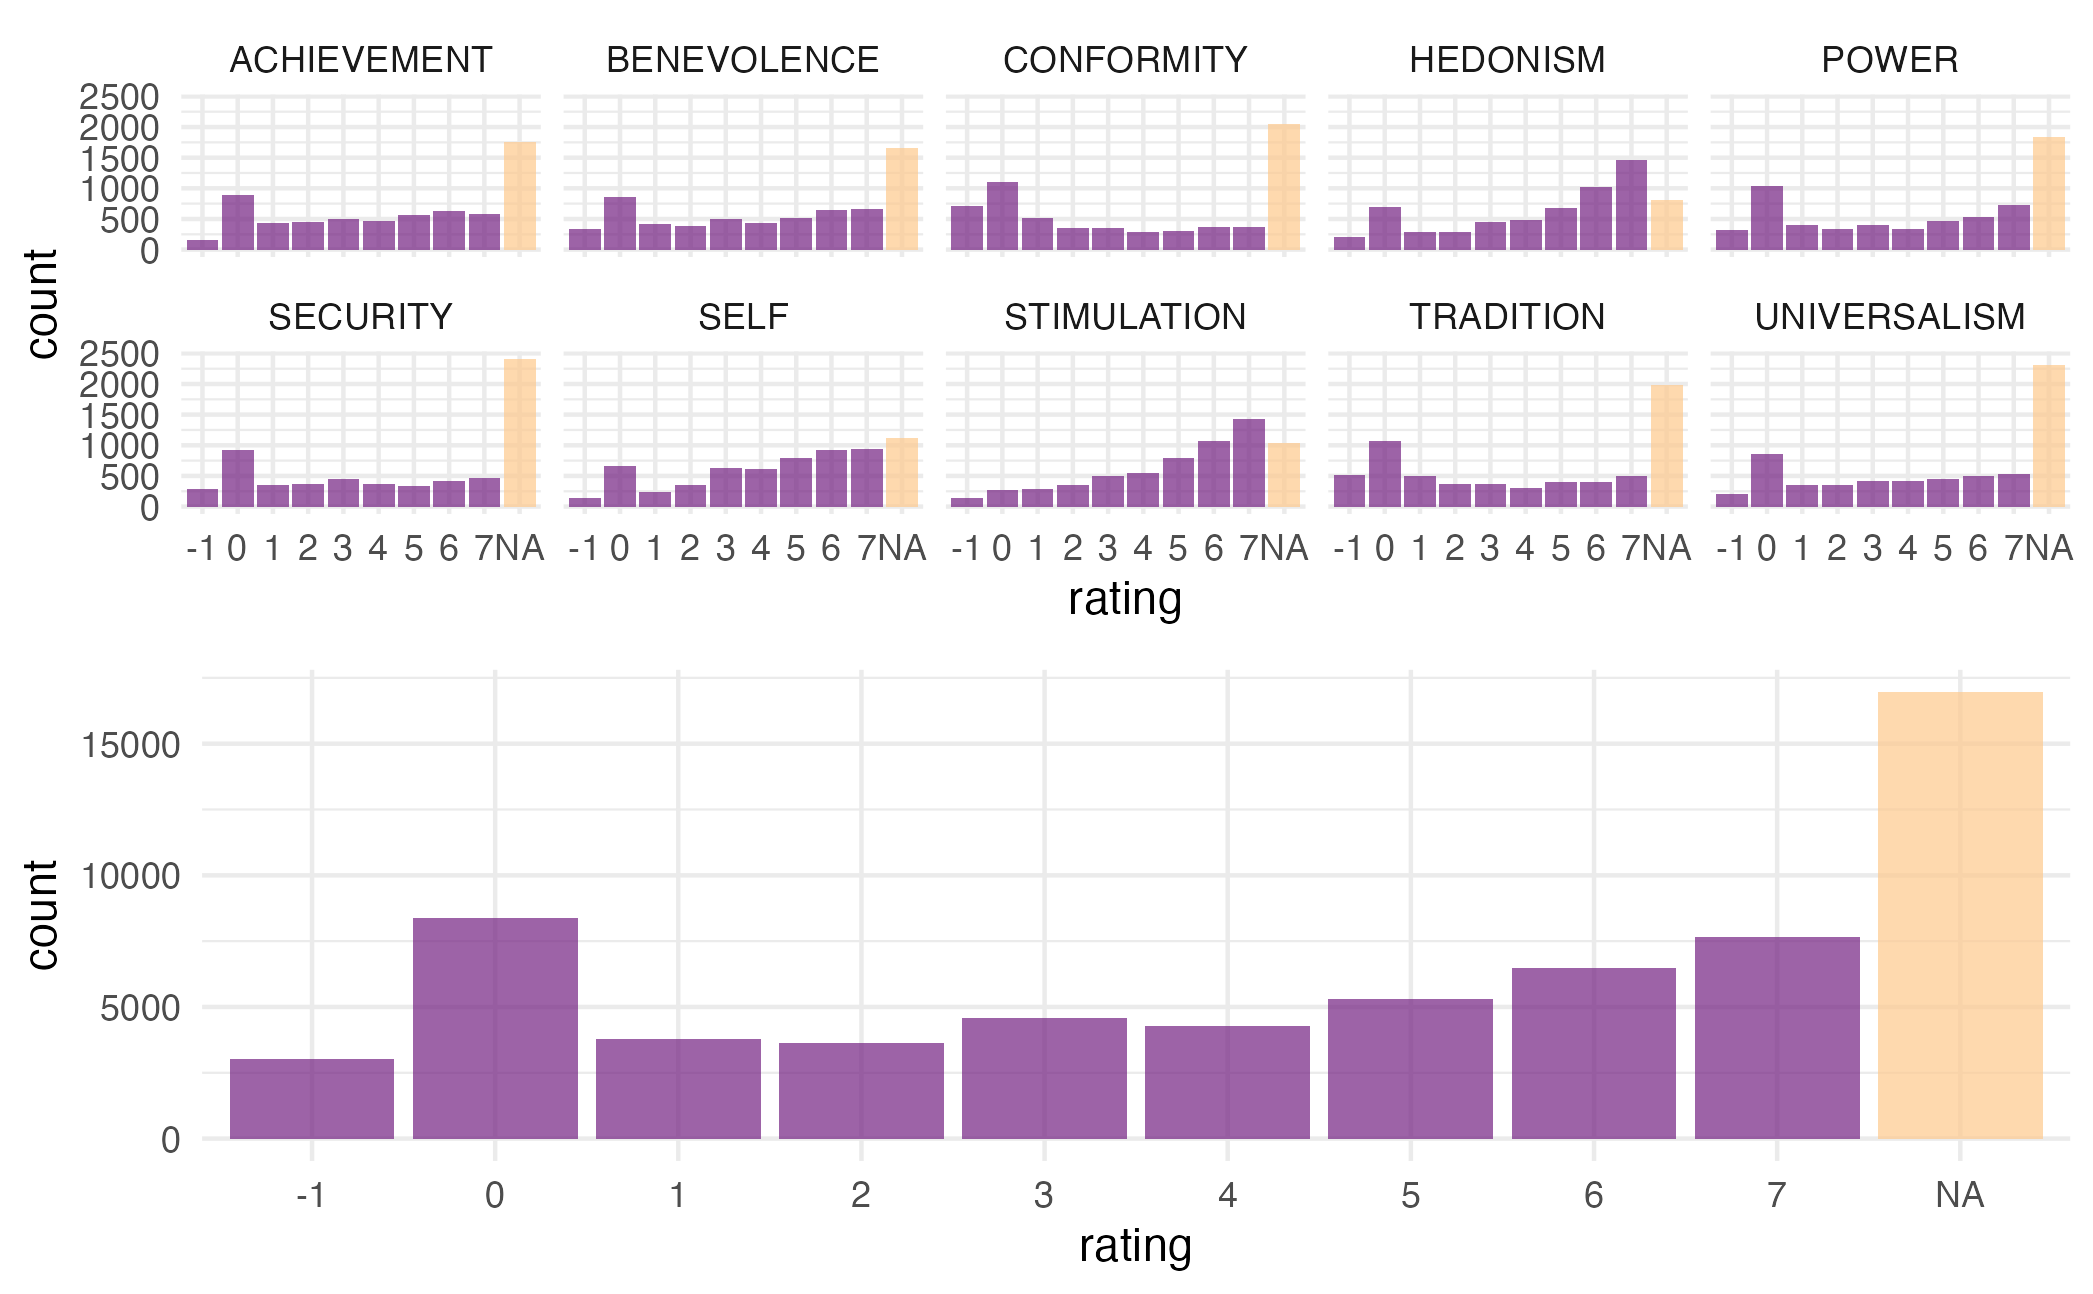
LLMs in our main study show a rather different distribution, with no NA values, but values that generally sit on the low end of the scale:
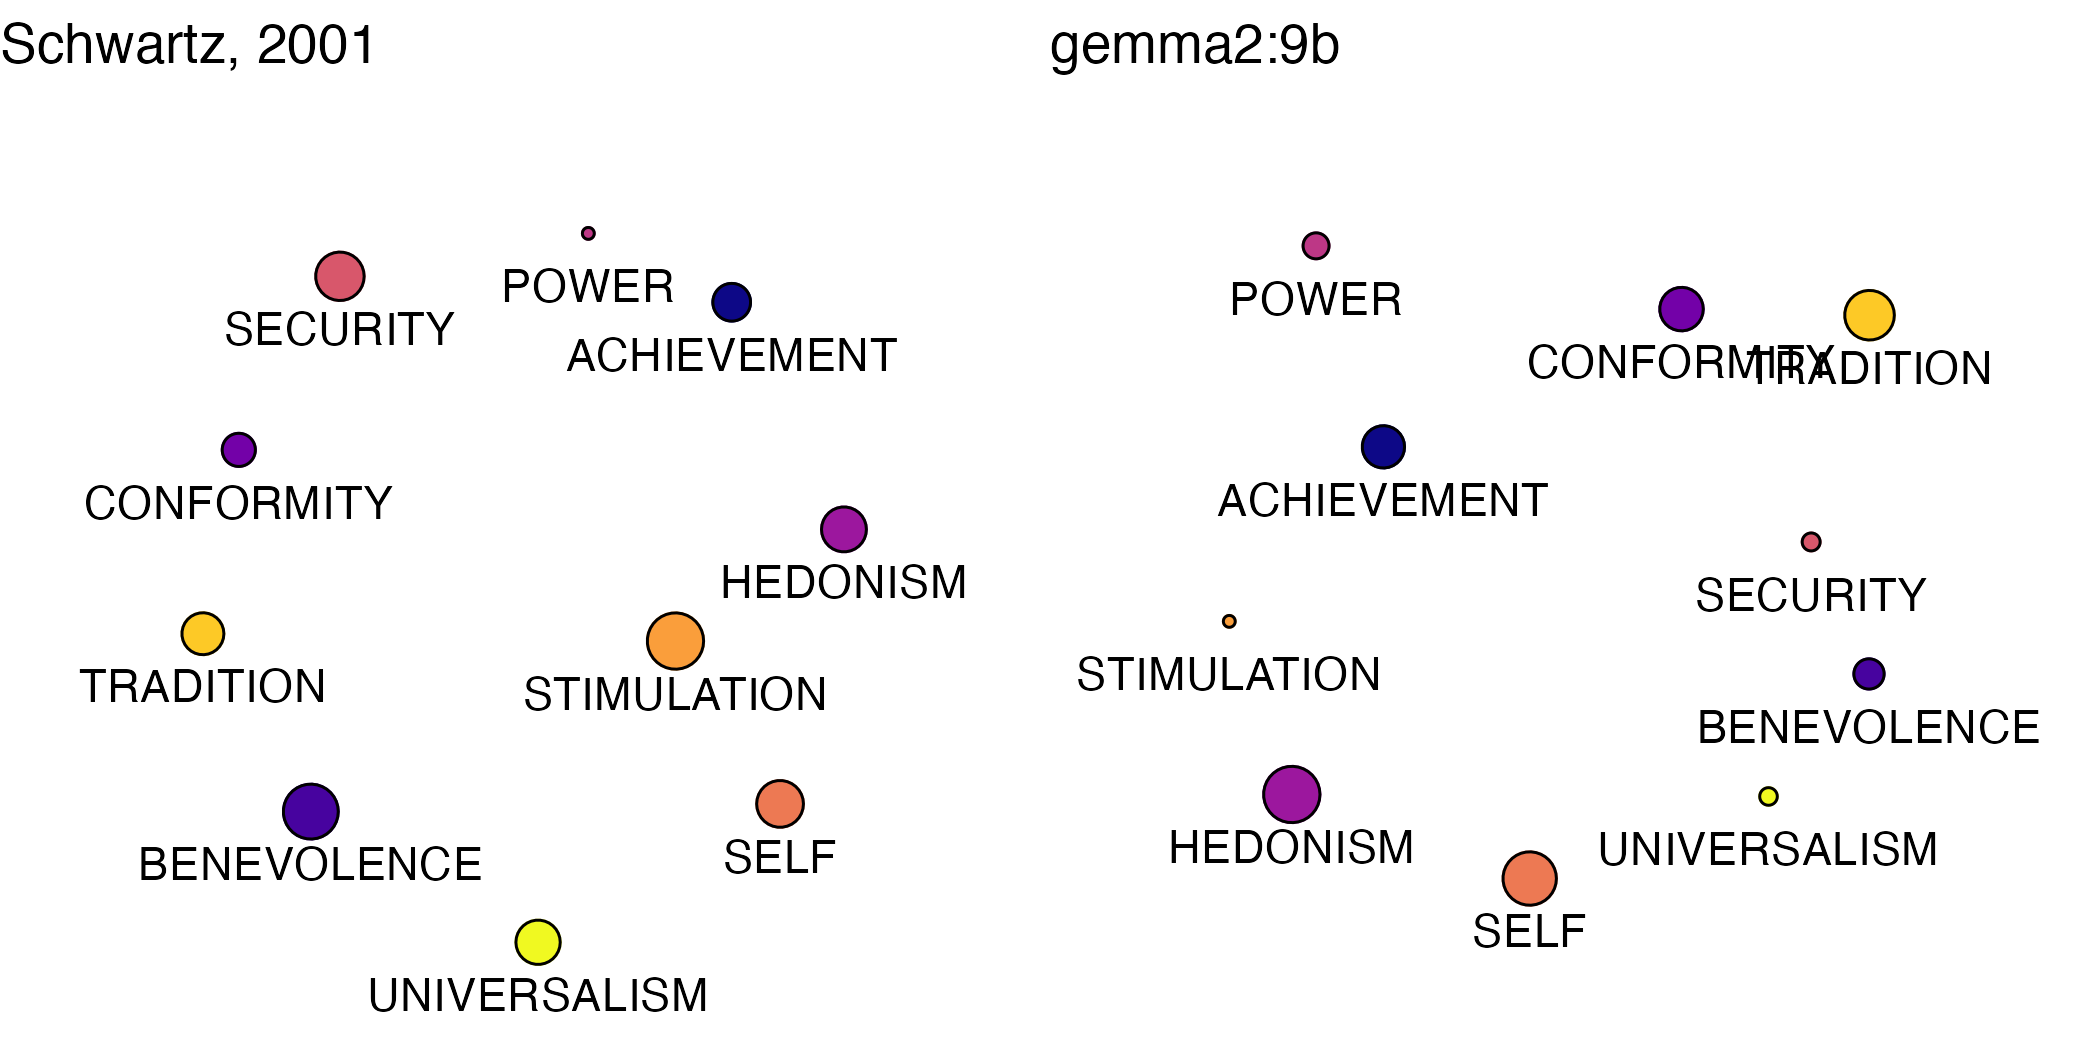
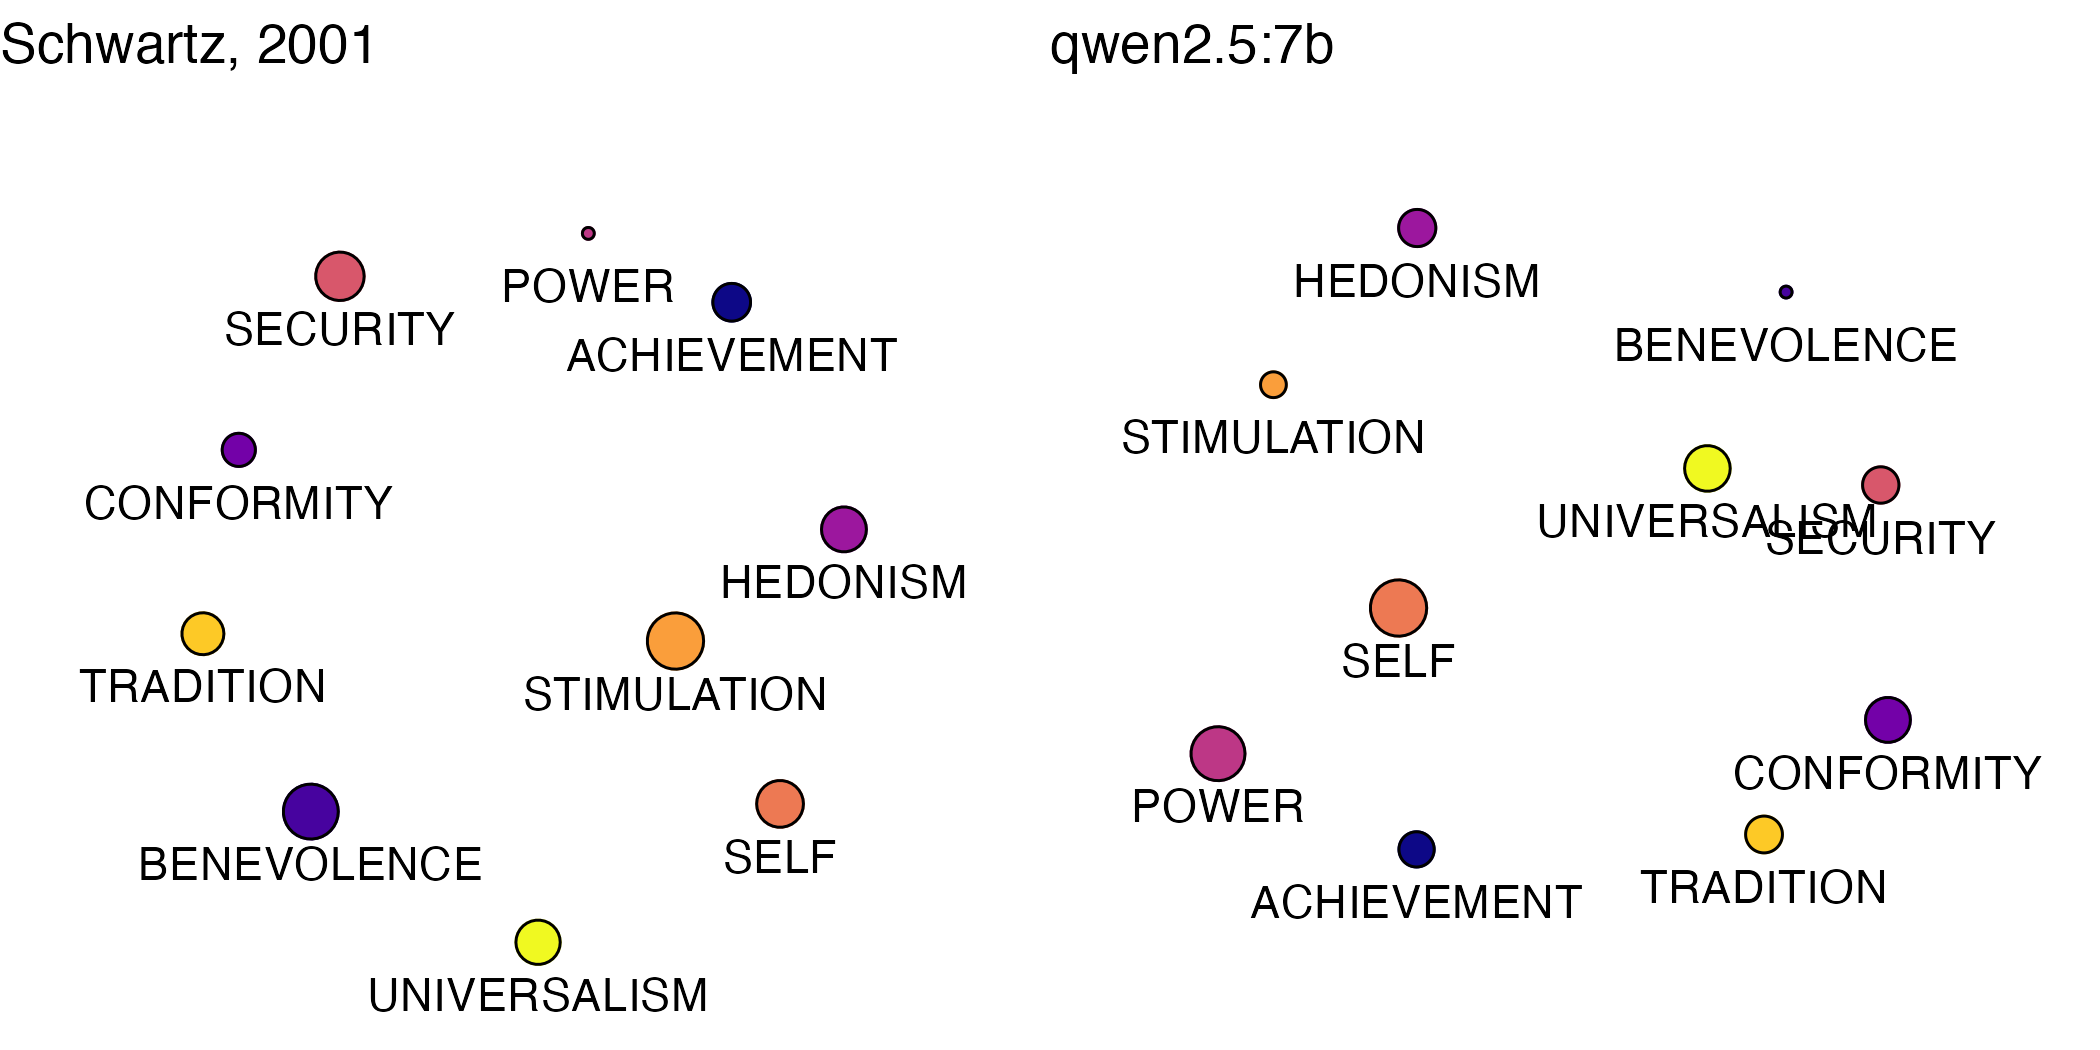
MDS Plots: LLMs vs. Participants
Means from participant ratings in our main wave of annotation data collection generally conformed to expectations in terms of patterns in the MDS plot. As explained in the paper, the test is to see whether values appear next to appropriate neighboring values. In nearly all cases, ours do.
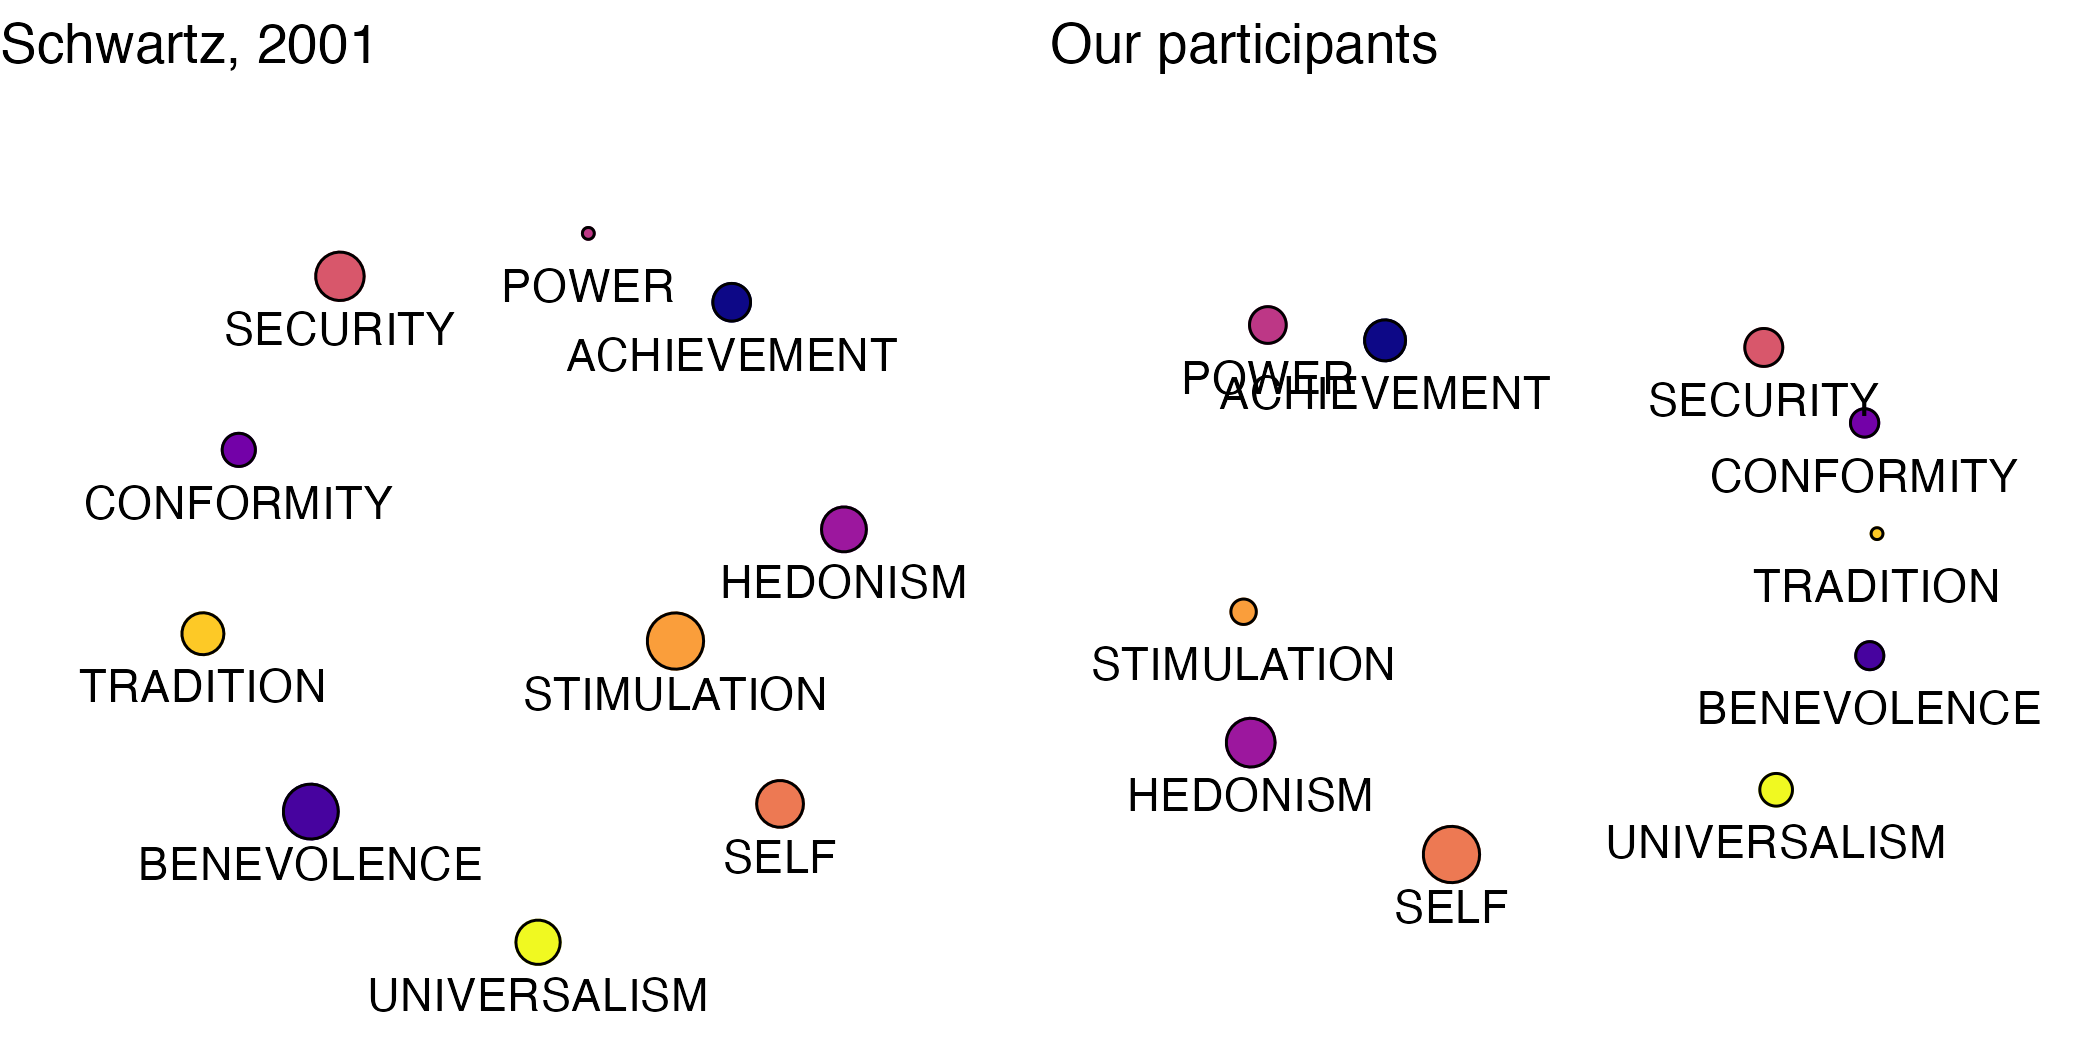
Understandably, the MDS plots for the models appear quite distorted.

Correlations
The means of 3 runs for the three model scores correlate moderately with each other. 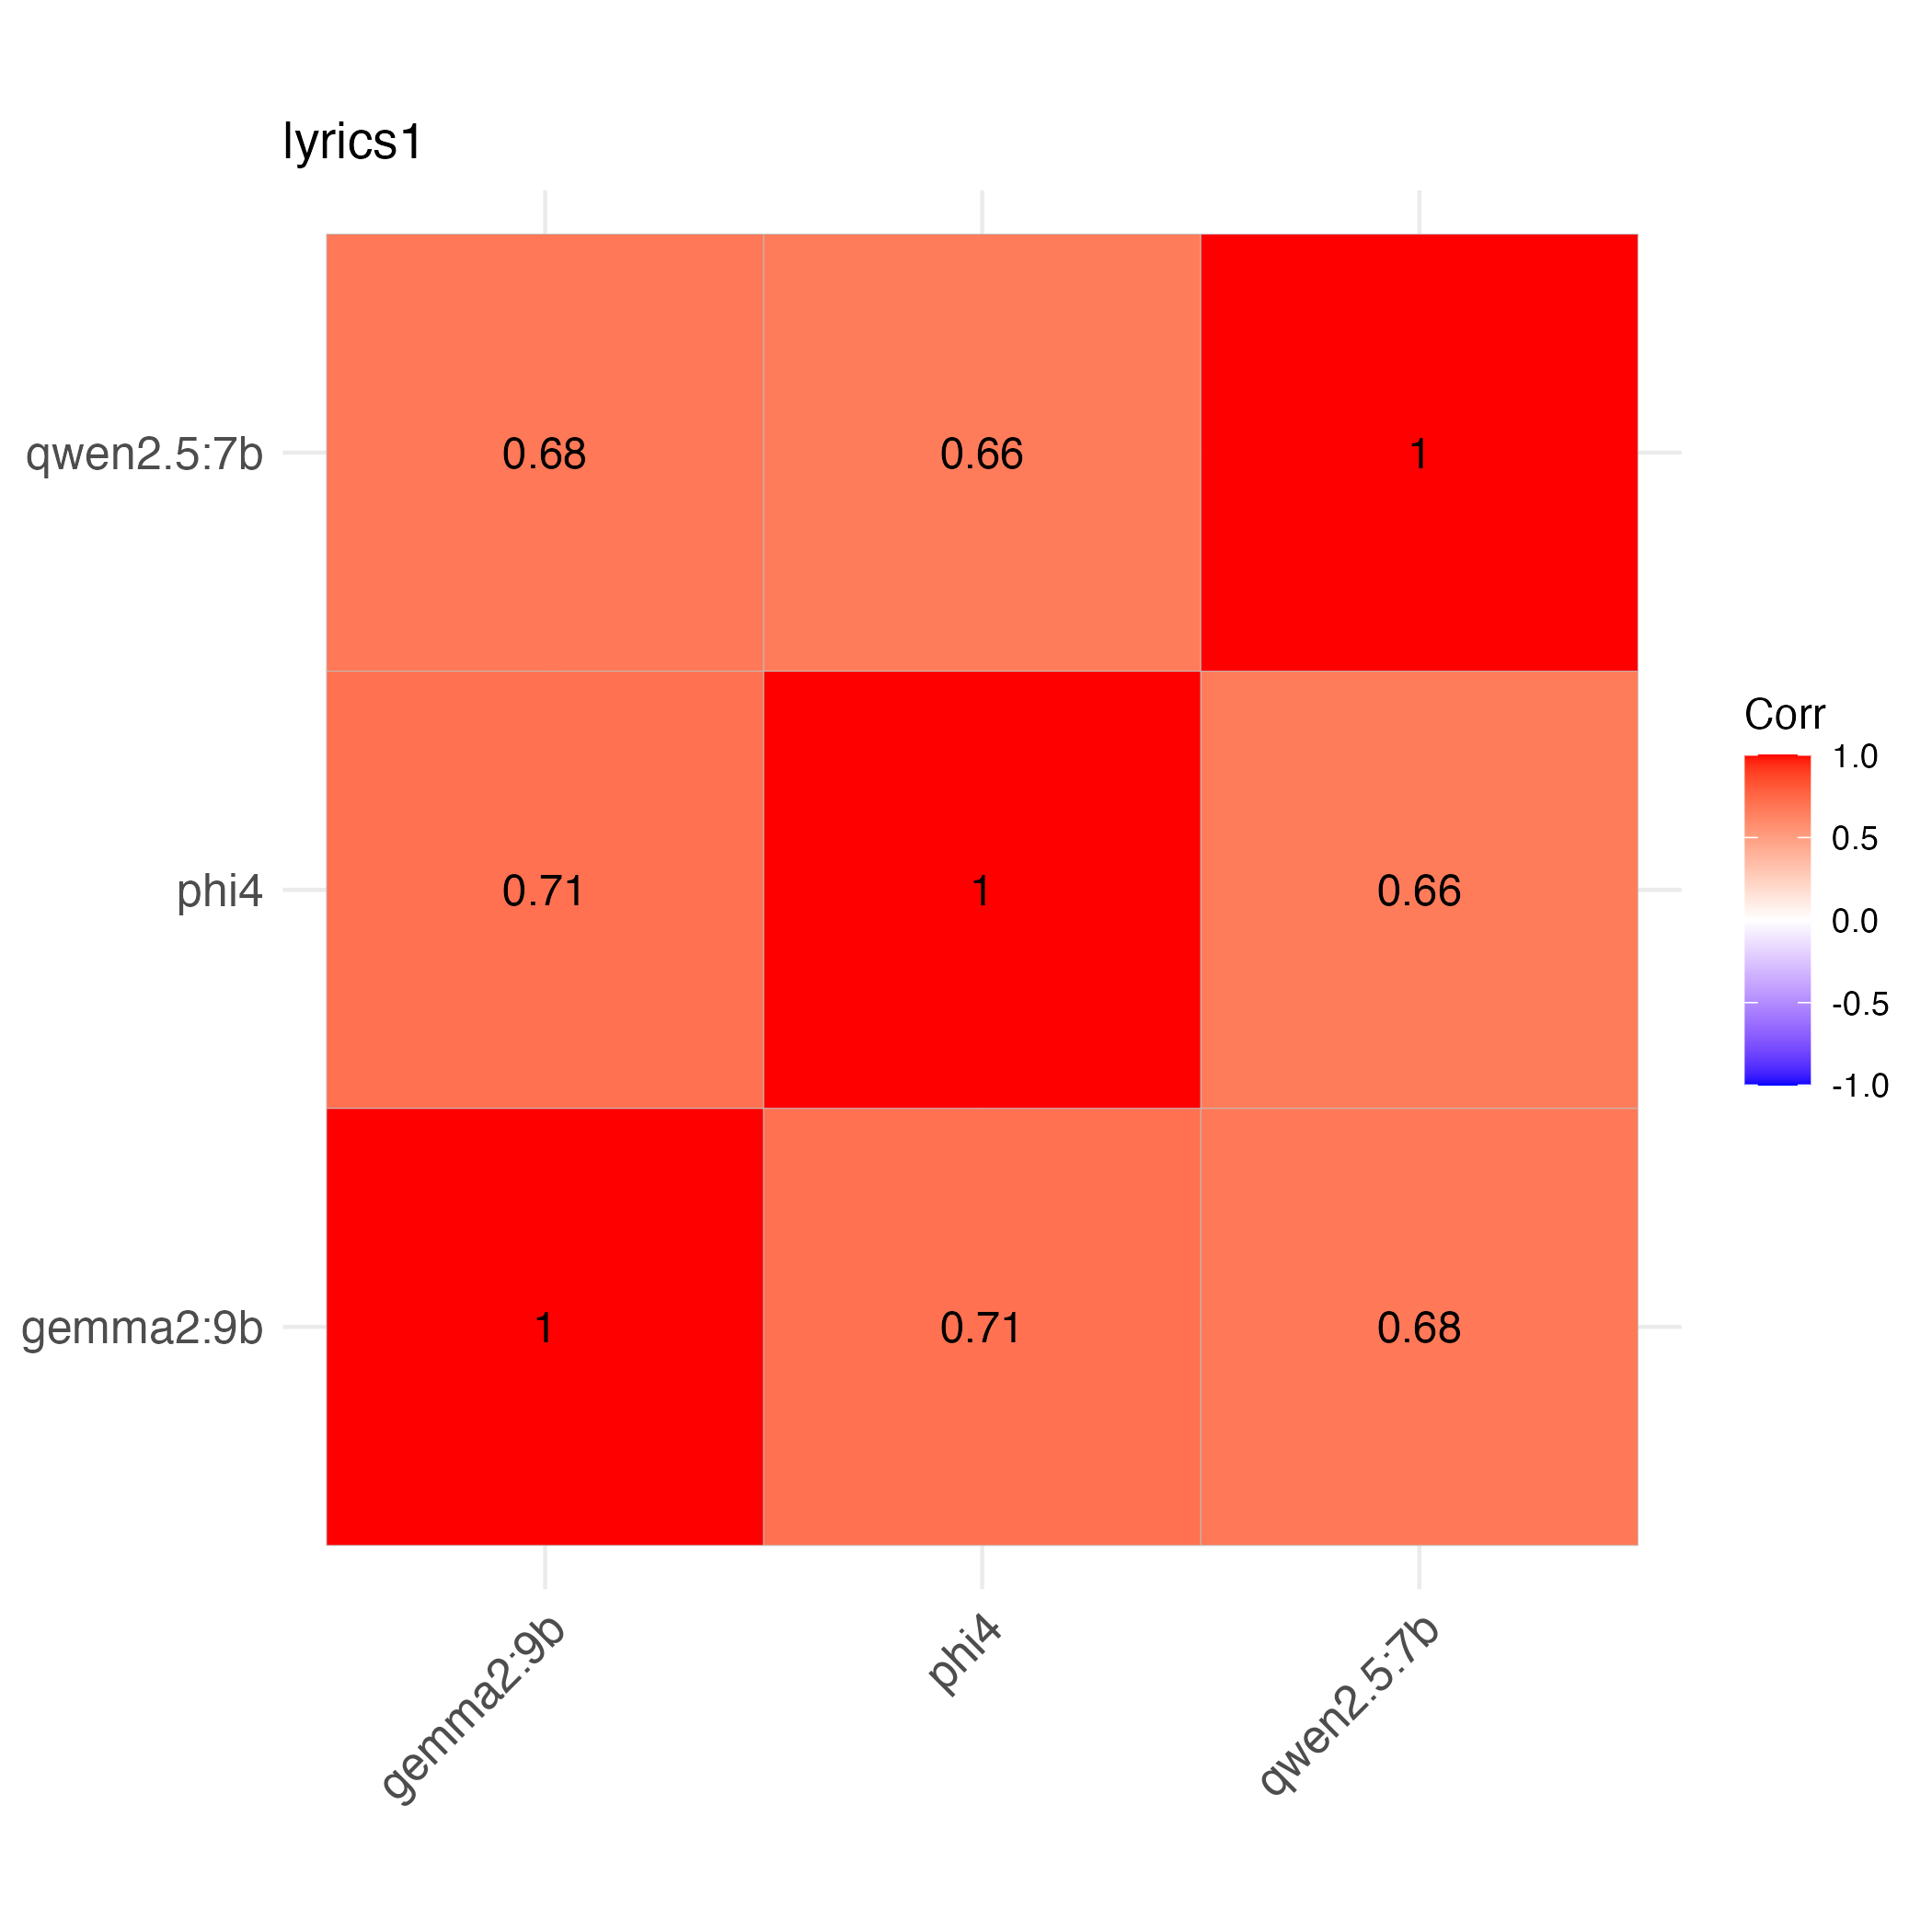
They correlate moderately overall with means from participant ratings.
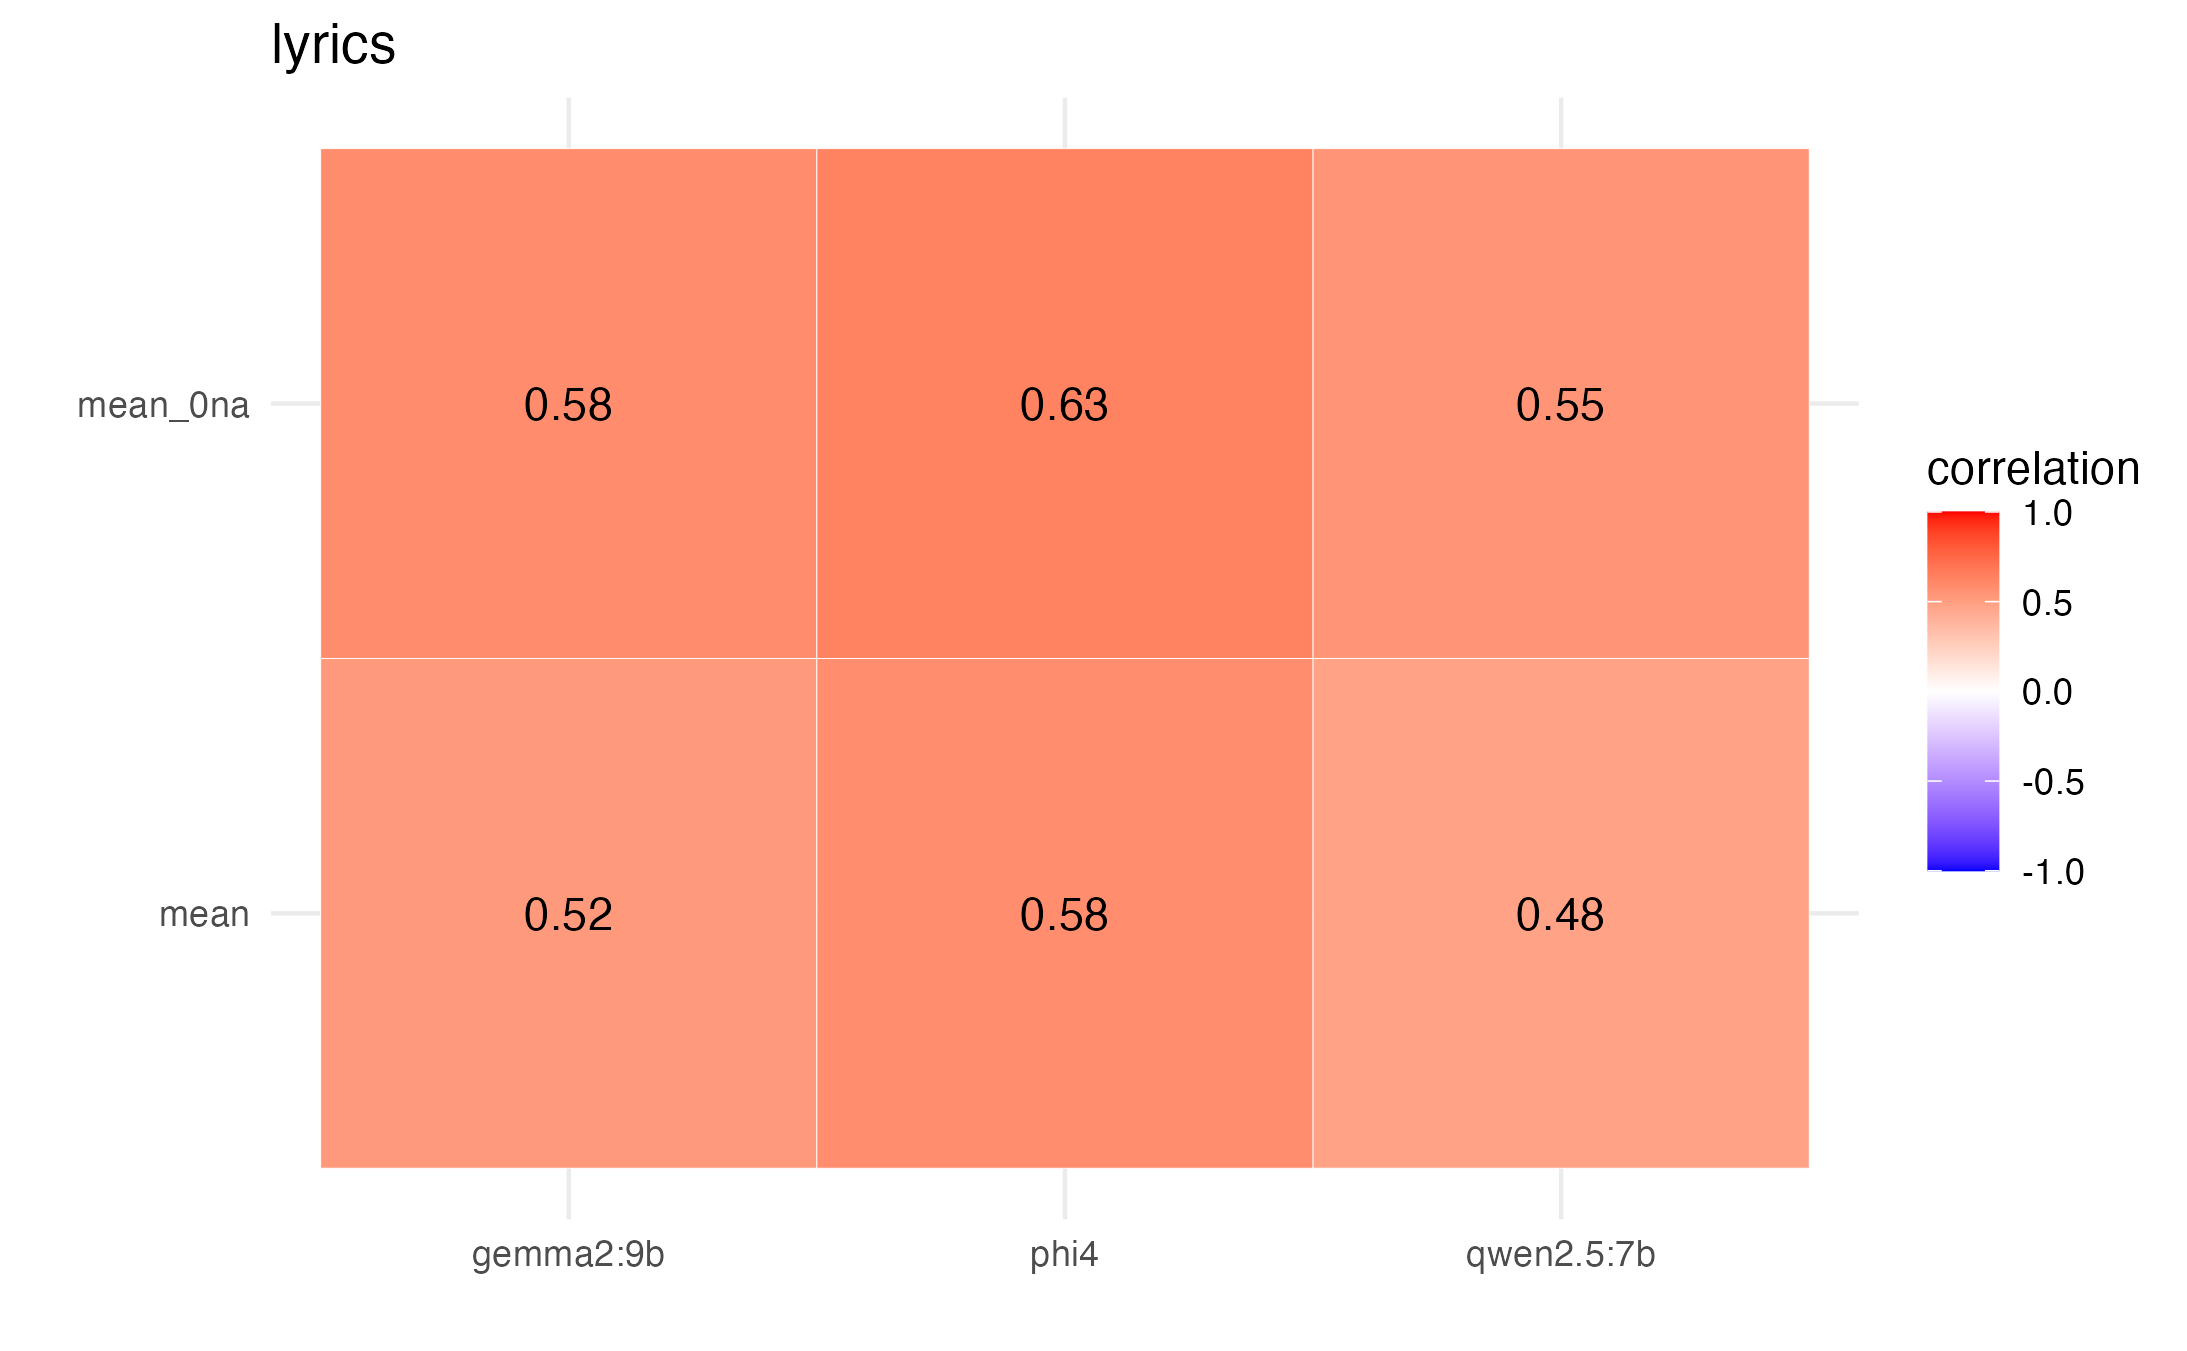
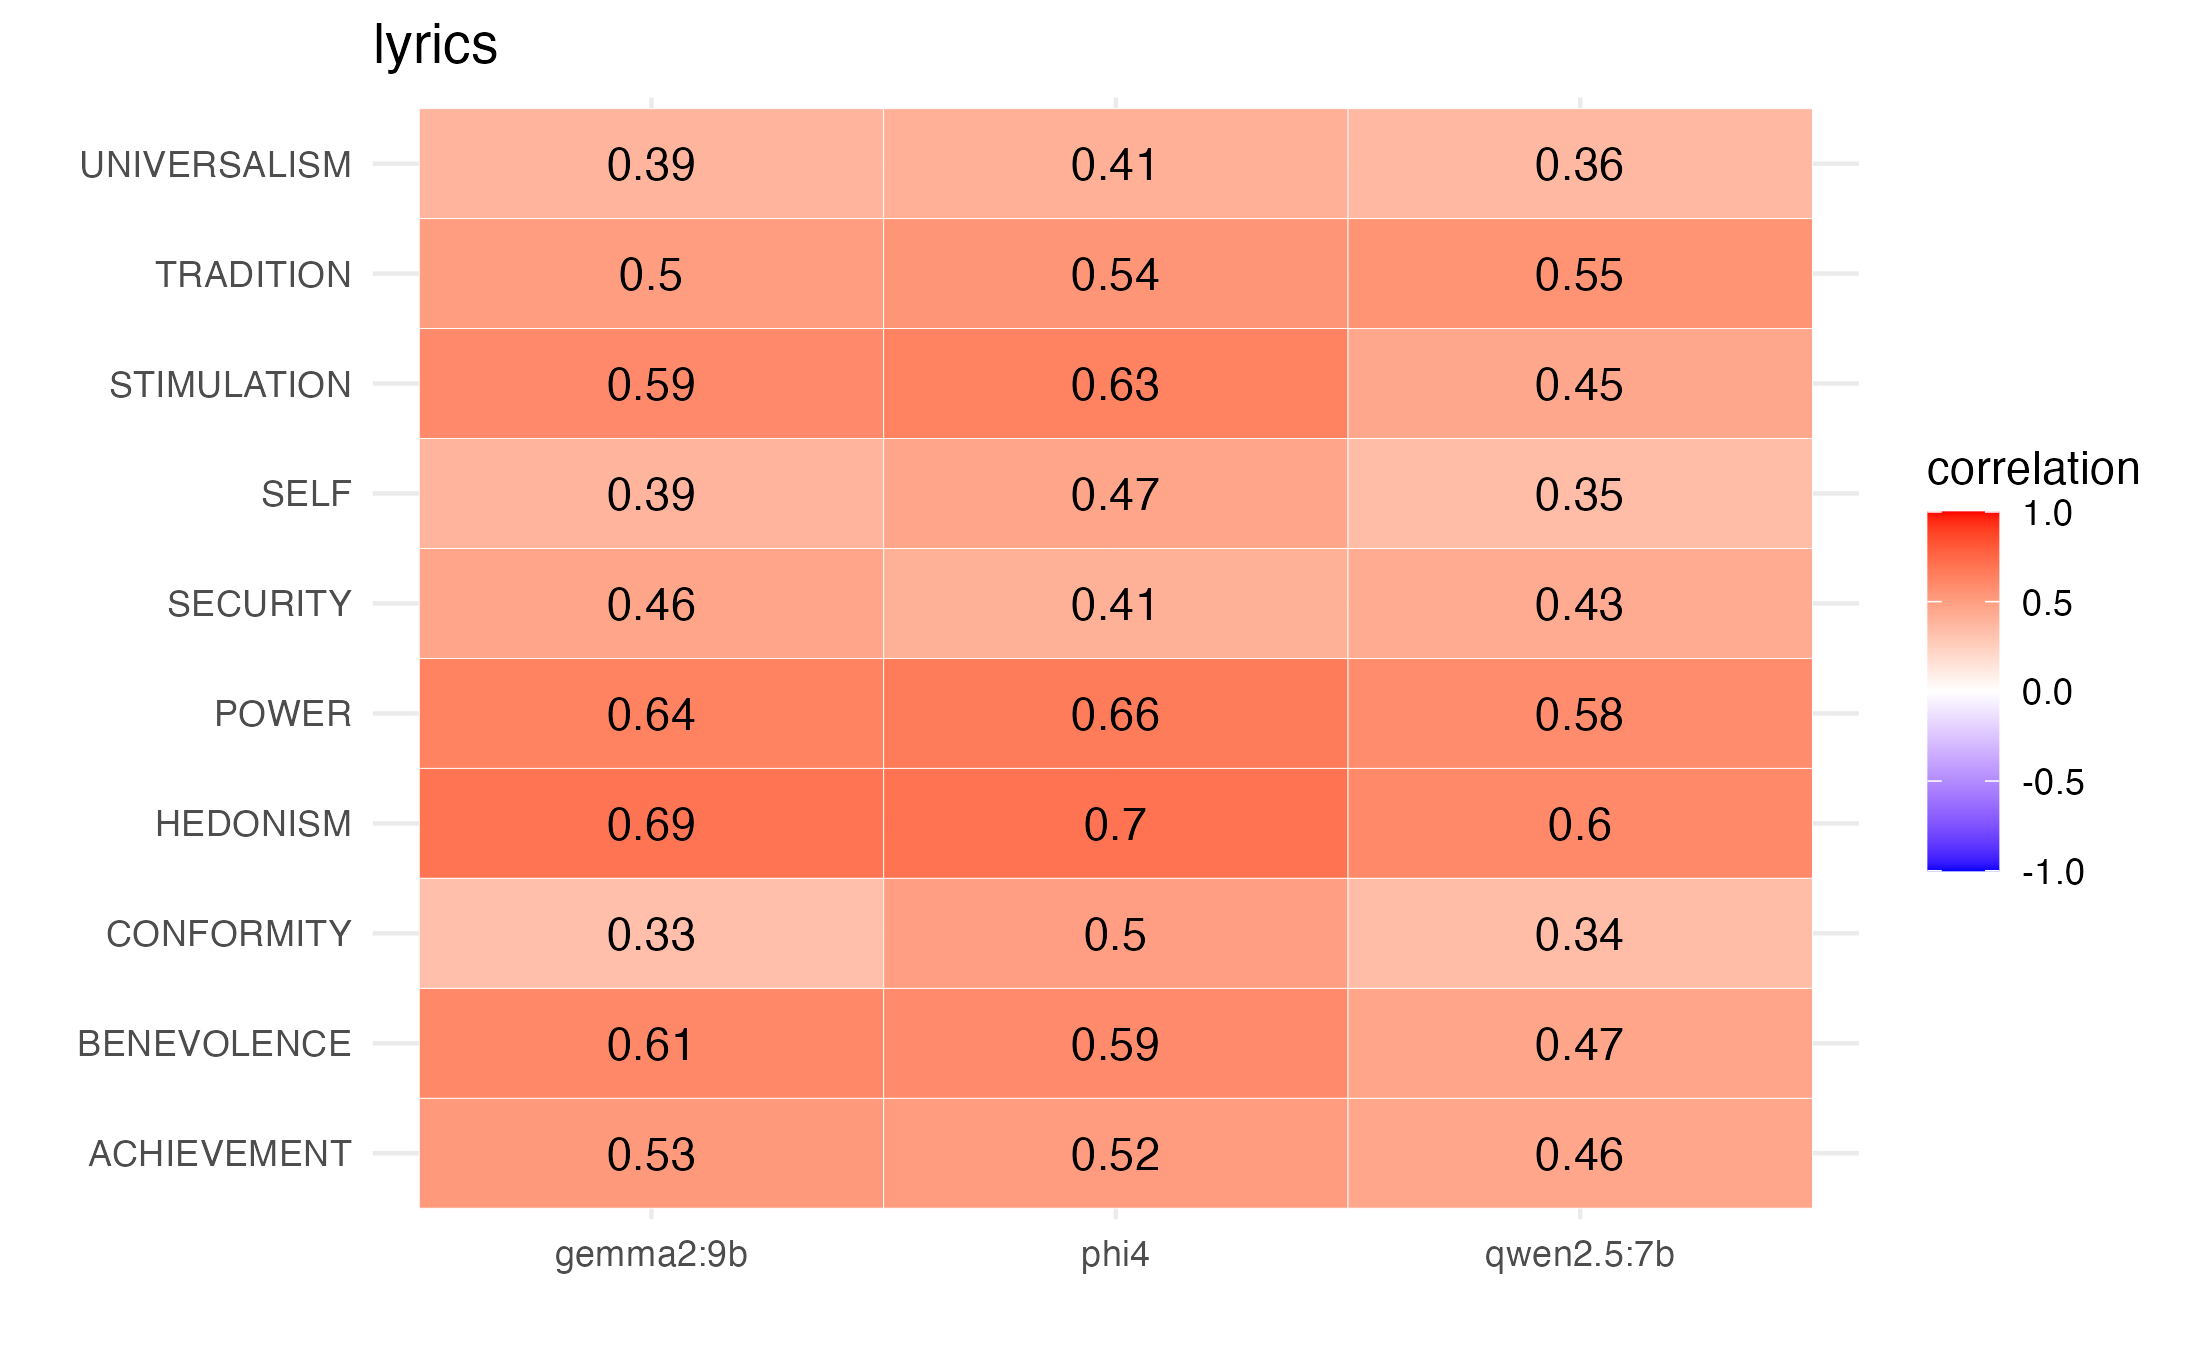
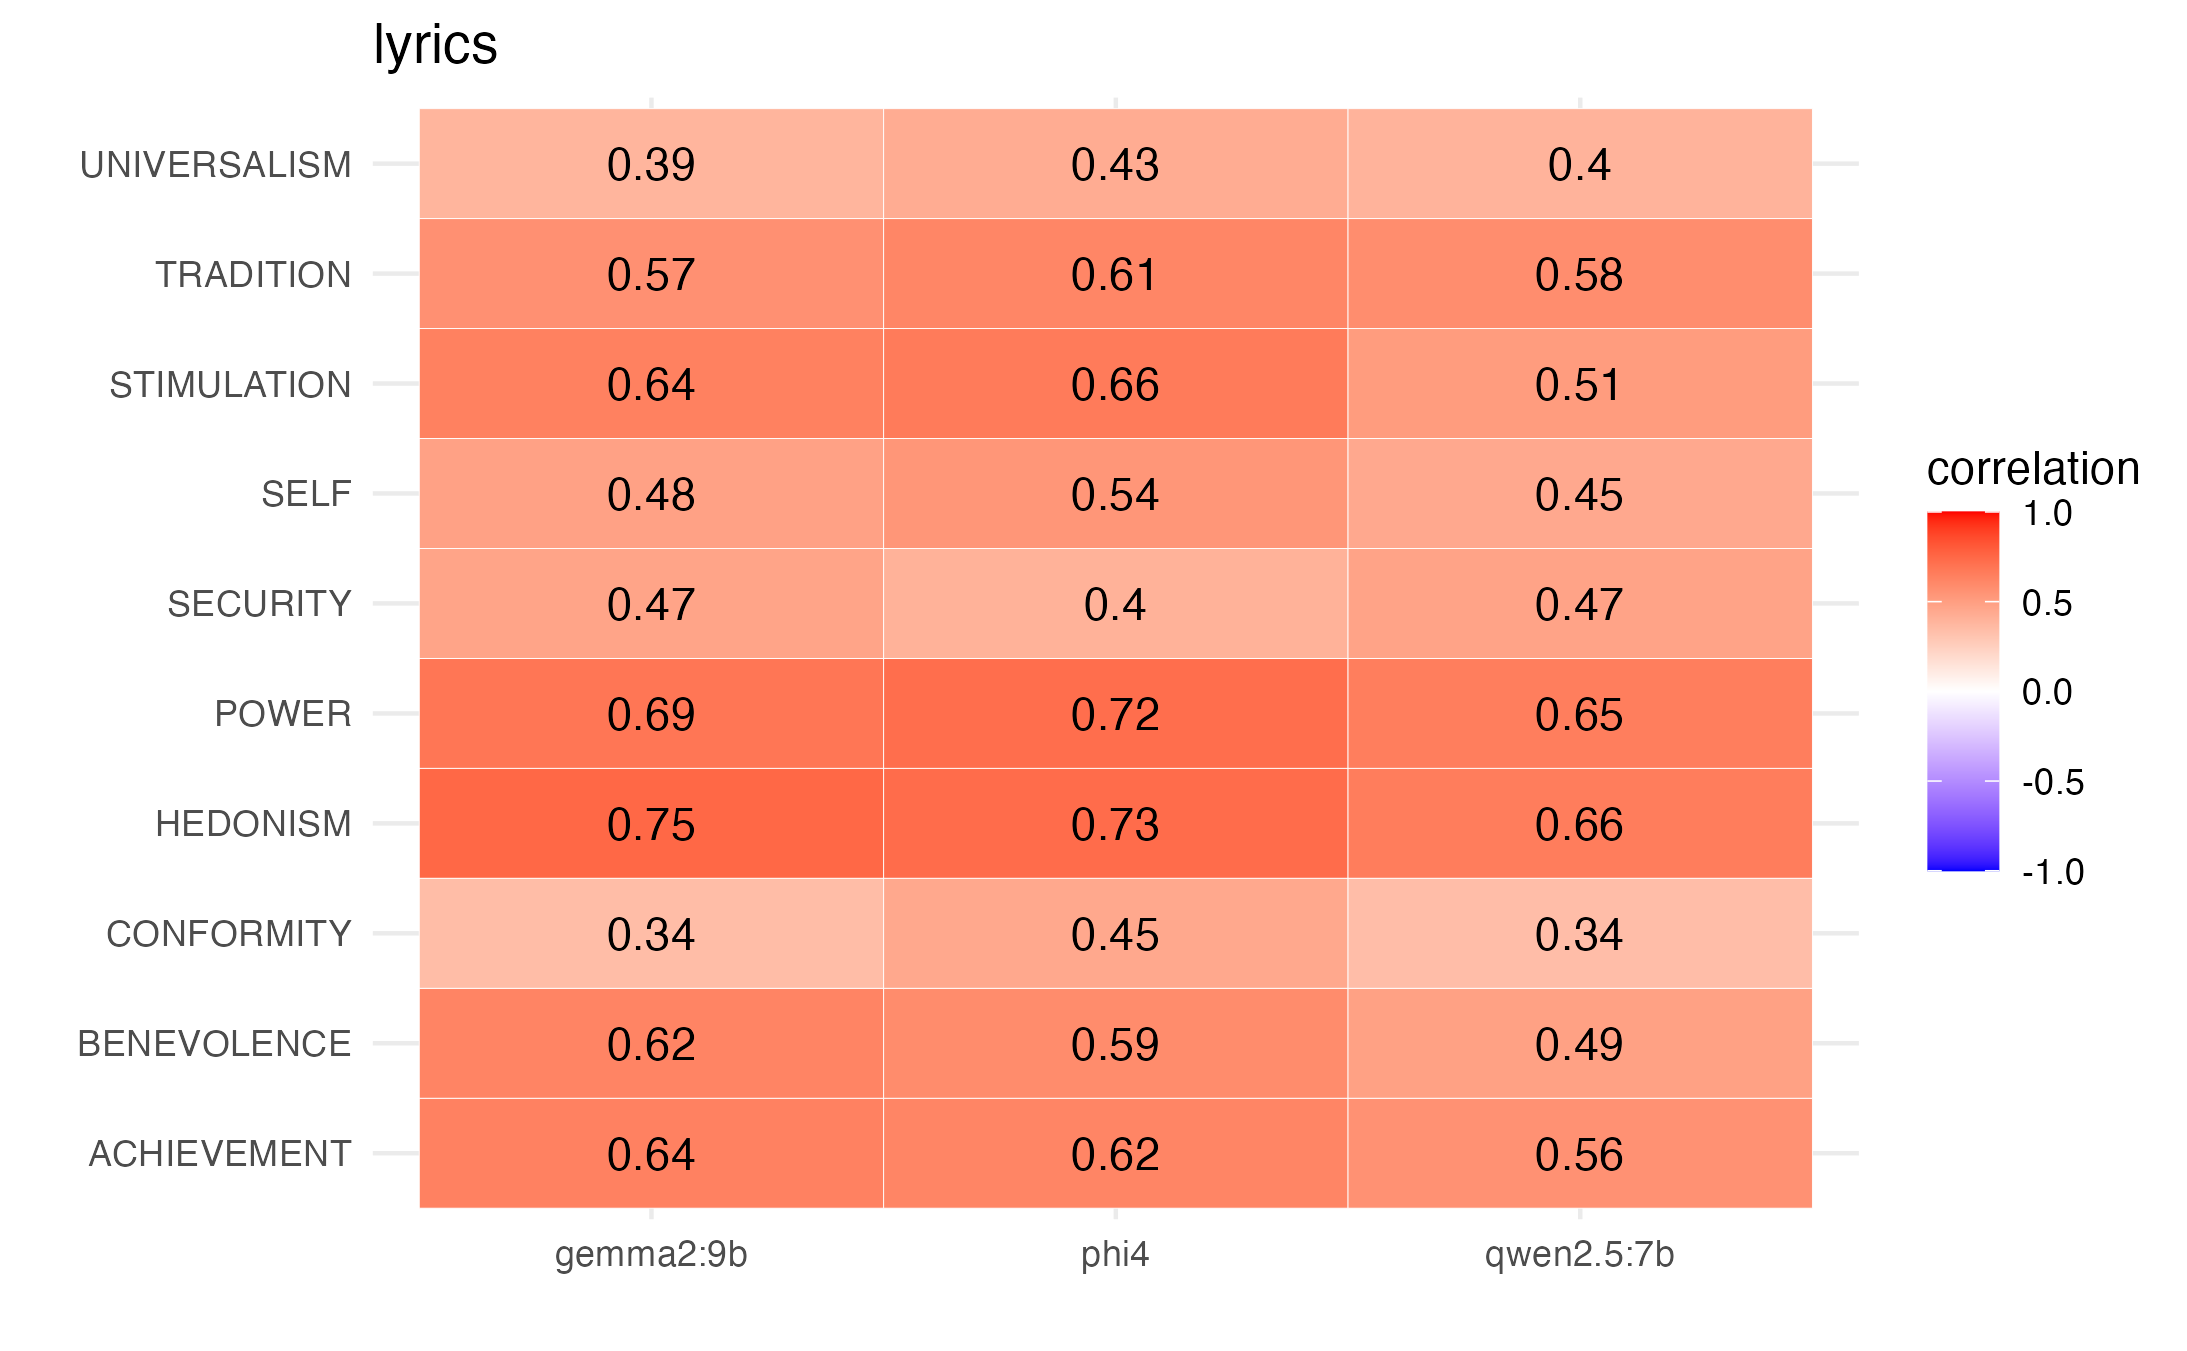
And we see overall moderate to strong correlations by value with participant mean ratings when NAs are left unchanged, and also when we treat NA values as 0.
Prior work has suggested that the actual ‘ground truth’ is a list of values. In other words, that each person has a hierarchy of these 10 values. To further explore this with our lyrics, we treat each lyric excerpt as a ‘person’, by computing a ranked list from the mean ratings of each value. We then do the same with our LLM ratings, and compute ranked list correlations per song. Here we plot the distribution of ranked list correlations, per model.
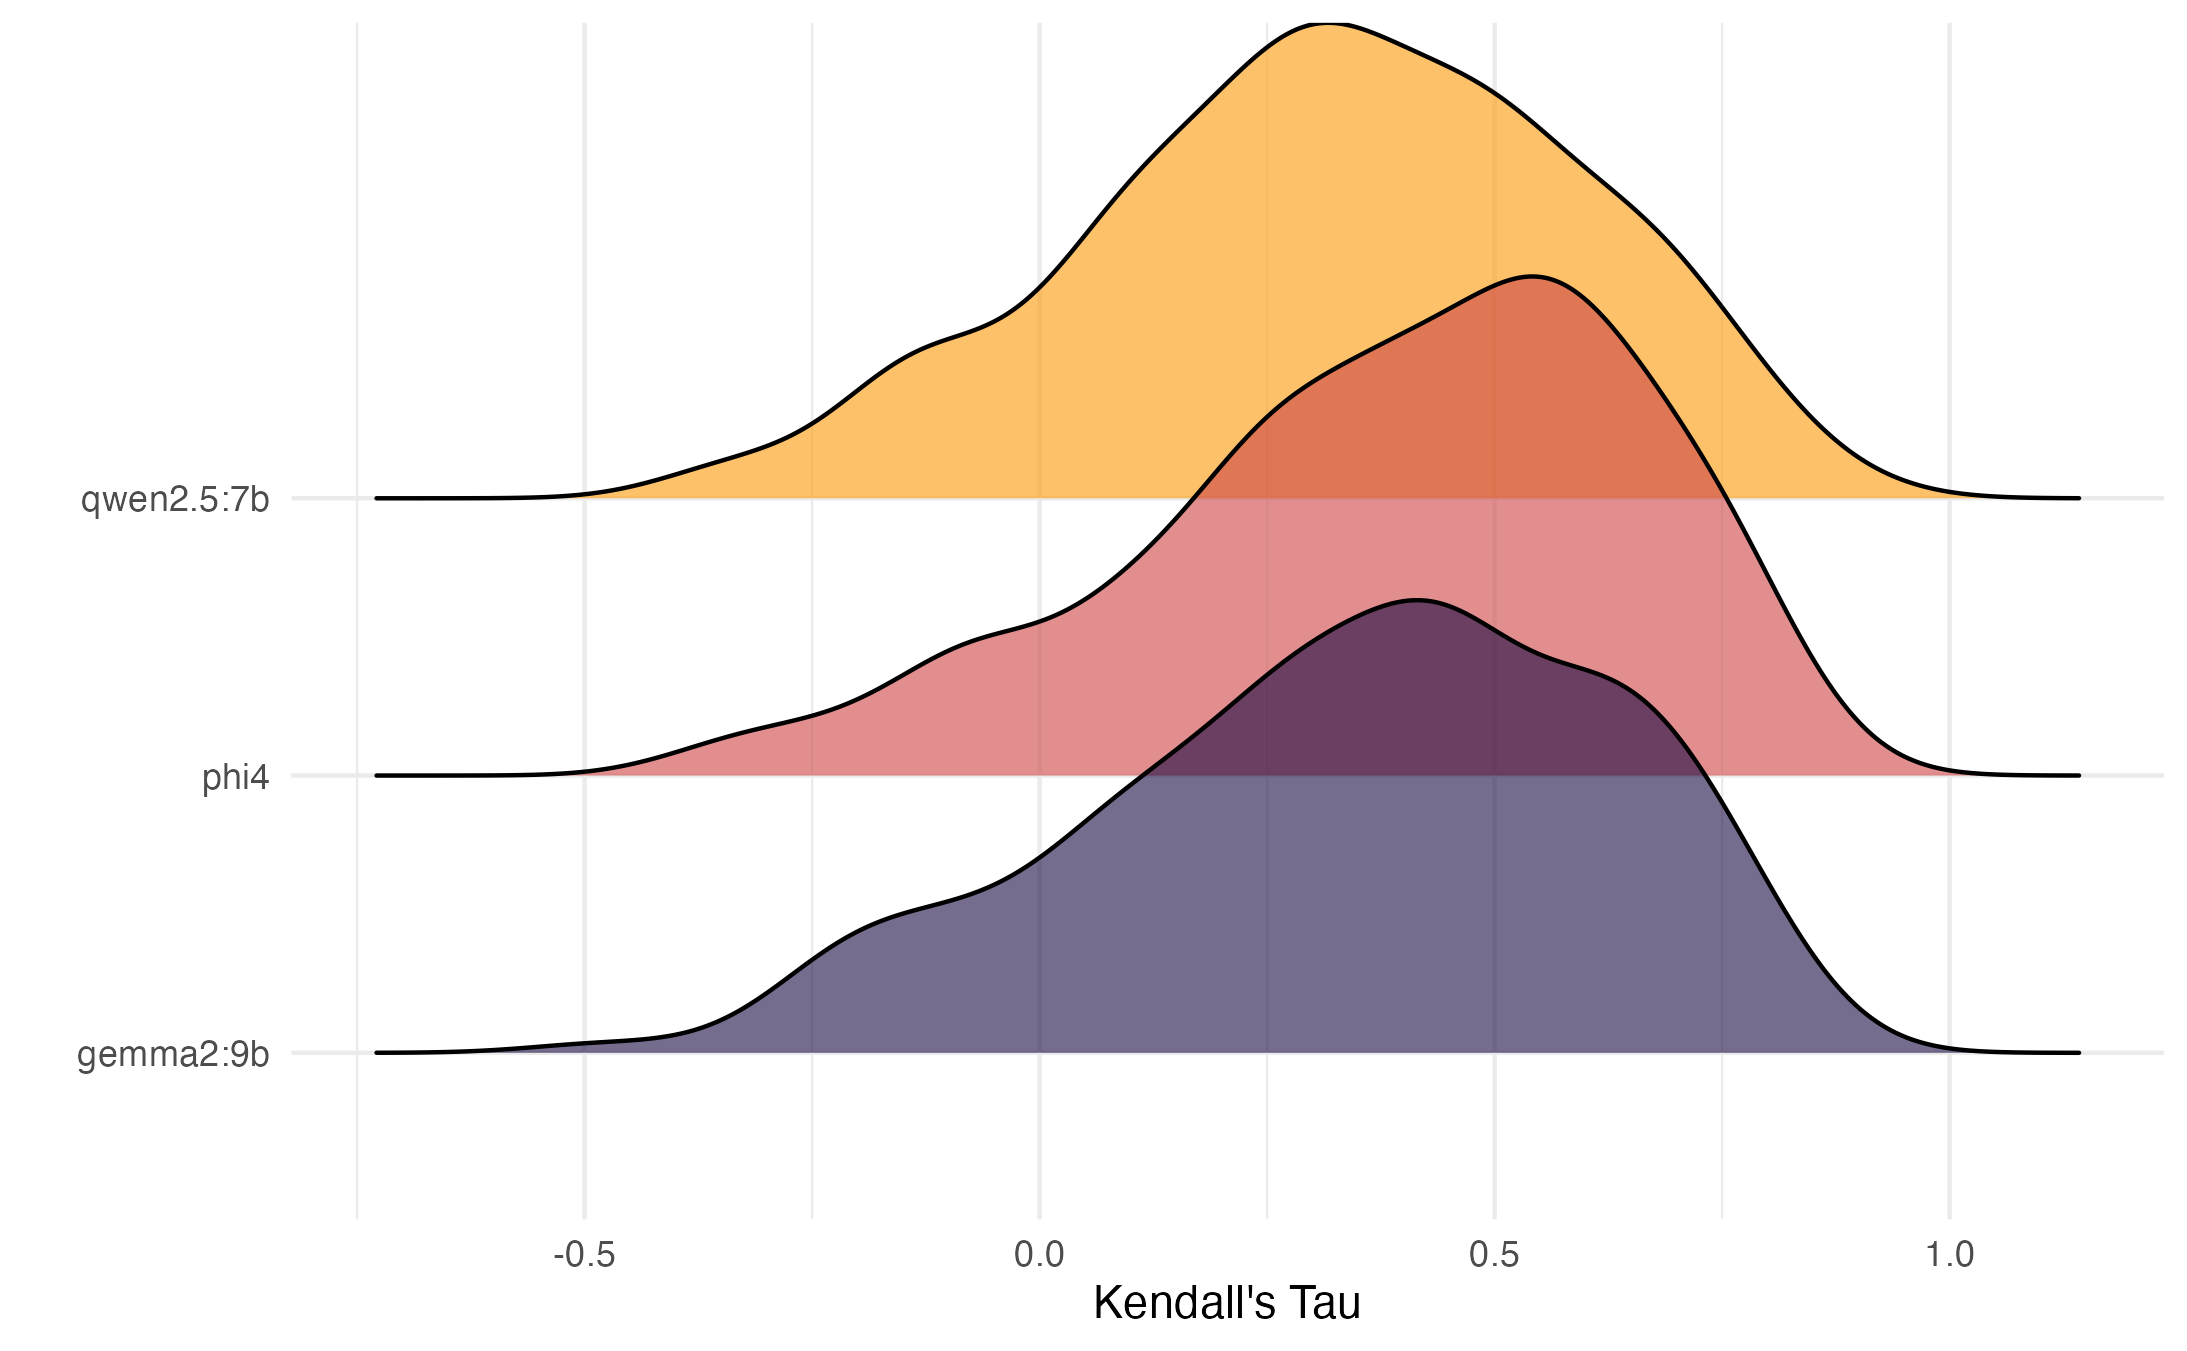
Prior work has suggested that correlations of .2 are meaningful. Here we look at what proportion exceed that threshold, per model.
| model | n | prop |
|---|---|---|
| gemma2:9b | 284 | 71.0 |
| phi4 | 314 | 78.5 |
| qwen2.5:7b | 276 | 69.0 |
| Note: | ||
| Note. n = number of songs; prop >= 2 = proportion of songs |